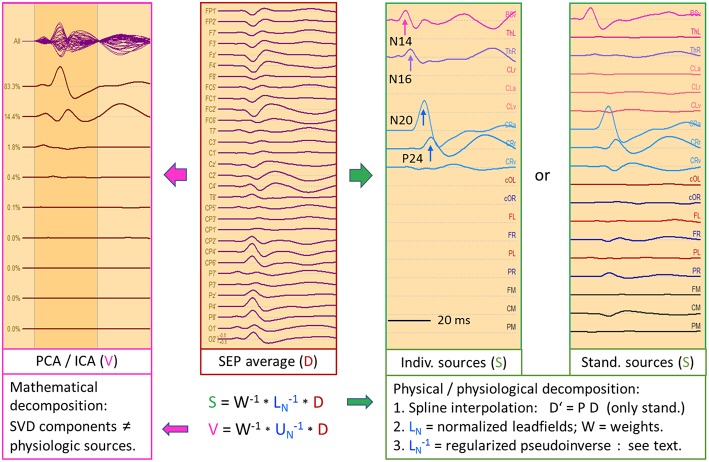
Figure 9.
Left median-nerve SEP—same subject, scaling and filtering as in Figure 8. Here, different types of linear decompositions are illustrated. First, one can use the 5 individual sources as in Figure 8, mirror locations and orientation from right to left, and adjust orientations to the peaks of N14, N24, and P24. The separation of components is highly similar to Figure 8, but the generators are now in the right hemisphere, contralateral to stimulation. When using the standard SEP source montage (right), one can immediately observe the separation of N14, N20, and P24, although N20 and P24 have not been oriented optimally, so that some activity is shared with the 3rd dipole of CR. The other regions do not contribute to the SEP in this time range and partially shield the deep radial generator of N16 in the right thalamus. This separation in matrix S is enabled by using an appropriate physical and physiological model defined by the leadfields of the sources. If we use a blind, purely mathematical decomposition of the data matrix D, e.g. singular value decomposition (SVD) or ICA, the resulting waveforms V do not show an interpretable decomposition (left).

