Figure 1.

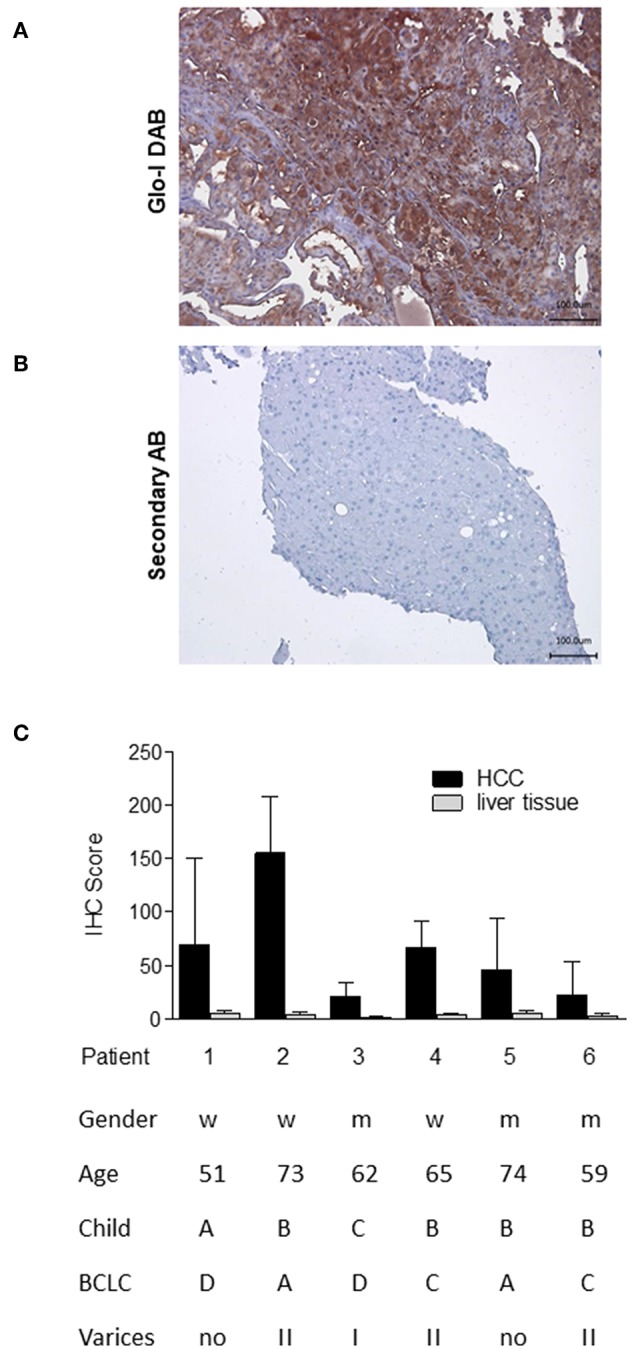
Expression of Glo-I in human HCC obtained by liver biopsy. (A) Representative image of Glo-I DAB-immunostaining indicates high expression of Glo-I in HCC biopsies. Staining controls lacking the primary antibody are presented in the lower line. (B) Quantification of at least 20 sections per biopsy using the Quick-Score (Q): Q = P [percentage of cells) × I [intensity absent (1), partial (2), complete (3) staining], maximum = 300. Quick-Score was also calculated in non-HCC cirrhotic liver tissue. In all analyzed specimens, Quick-Score of non-HCC tissue was much lower than in HCC tissue (C) Clinical data, including Child-Pugh classes and BCLC stages of analyzed patients.
