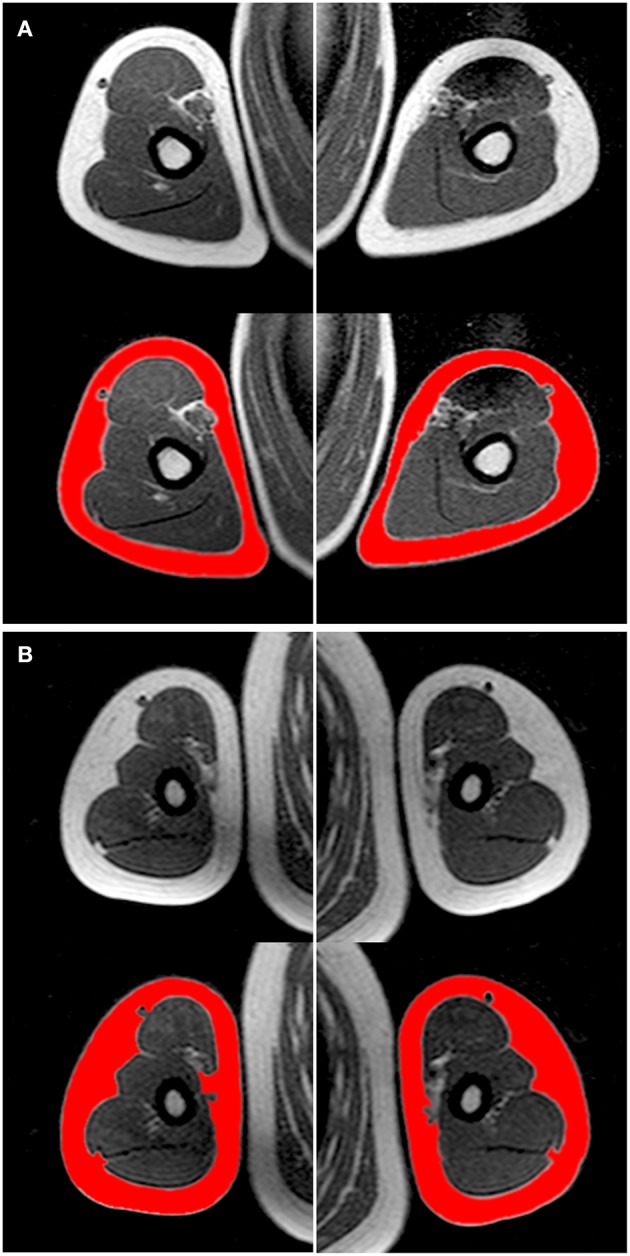
Figure 3.

Axial T1-weighted in-phase non-fat saturated magnetic resonance images at the level of the mid-arm, illustrating the subcutaneous adipose tissue of (A) a child tennis player and (B) an inactive child (weight 35.6 vs. 41.7 kg, height 148.1 vs. 147.5 cm, age 11.0 vs. 10.2 years, respectively, both Tanner stage 2), matched for height and age. Top, gray-scale images; bottom, corresponding analyzed images (in red, the subcutaneous adipose tissue) (Supplementary Material).
