Figure 3.
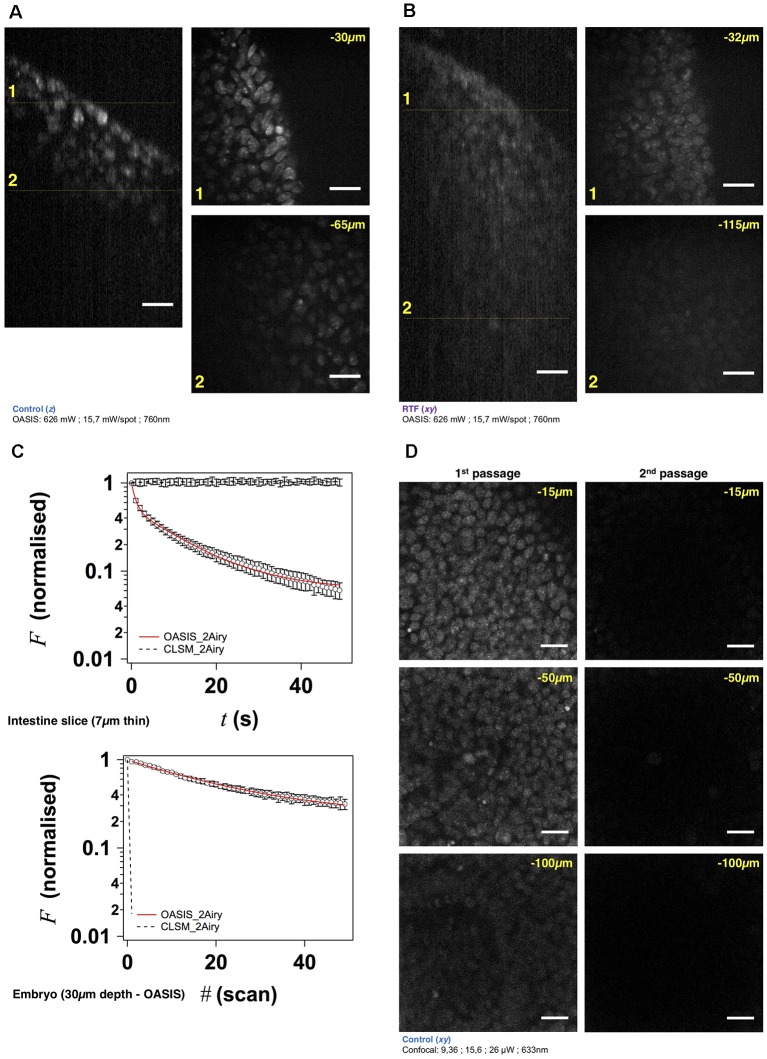
The OASIS microscope outperforms a CLSM point-scanner for 3-D embryo imaging. (A) 3-D data set taken with the OASIS in a non-cleared embryo stained with TO-PRO3 (Control). Panels show xz- projection of a z-stack of images (right) and xy-planes (left) corresponding to the dashed lines at 30 μm (1) and 65 μm imaging depth (2), respectively. Scale-bar, 25 μm. (B) same, at 32 μm (1) and 115 μm depth (2), respectively, for an RTF-cleared embryo. Scale-bar, 25 μm, as in (A). (C) Representative bleaching curves during continuous acquisitions, from a single z-section in—respectively—a thin slice of intestine (top) and of TO-PRO3-labeled nuclei (bottom) at 30-μm imaging depth in an embryo. (D) Representative planes at various imaging depths (15, 50 and 100 μm, respectively) of a 3-D data set (200 planes from the surface to 200 μm, Δz = 1 μm) acquired from a TO-PRO3-labled embryo. The two columns show the sections during the 1st passage (left) and during the 2nd passage, after completion of the 1st image stack (right). Note the almost complete bleaching prohibiting repetitive volume imaging for the CSLM but not the OASIS microscope. Measured laser powers are given for each depth. Scale-bar, 25 μm.

