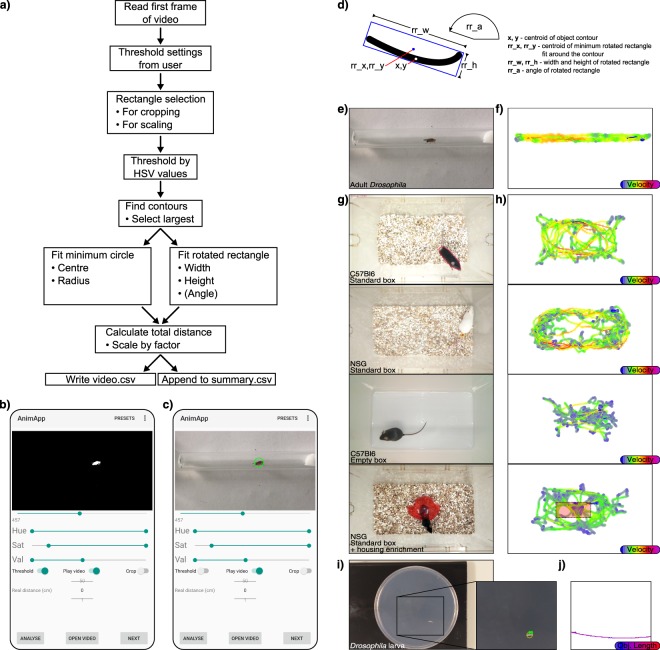
Figure 2.
(a) Flowchart for AnimApp function for analysis of recordings. Upon opening a video file in AnimApp, the first frame is shown as a preview. A green marker square can be drawn for video cropping (‘Crop’ switch), or alternatively for reference to a known scale such as a visible ruler. (b) Activating the “Threshold” switch allows precise setting of the Hue, Saturation and Value (HSV) sliders in order to set the colour threshold for animal detection. The slider under the preview frame can be moved to test the threshold settings frame-by-frame throughout the video. Preset HSV thresholds can be loaded from the “Presets” tab (see Supplemental Fig. 1,a). (c) Resulting individual animal detection indicated by green circle. Tapping ‘Play Video’ runs the video during analysis to check detection accuracy, while tapping ‘Next’ proceeds to analyse the video. (d) Example object contour and labels describing AnimApp.csv output columns. (e) Example adult Drosophila video and (f) path tracking, with colour indicating relative instantaneous speed. (g) Mouse detection in home cage or empty transport box, with white mouse detected by a red pen marking at the base of the tail, and a representative translucent red housing enrichment object. (h) Resulting path traces of the respective animals in (f) with the processed path colour indicating instantaneous speed. The translucent red square indicates the “centre of the box” area used in calculations for Fig. 3f. (i) Equivalent setup for tracking a white Drosophila larva over a dark agar plate. (j) Plot of larvae path, with path colour indicating object (larval) length at each frame.

