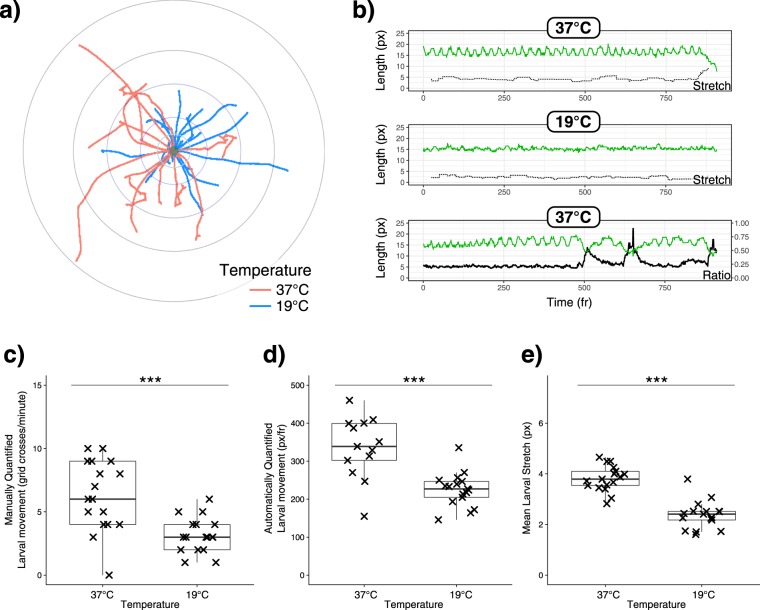
Figure 4.
(a) Normalised paths taken by Drosophila larvae incubated at 37 °C (red) or 19 °C (blue). (b) Example traces of larval length (green), mean larval stretch amplitude (also known as “striding”, dashed line) and the ratio of larval length:width (heavy black line, on secondary y-axis) over time (frames) from representative videos of larvae incubated at 37 °C or 19 °C. (c) Manual quantification of distance travelled in 1 minute, by counting of grid-line passing events, and (d) using AnimApp for automatic quantification of distance in the same videos. (e) Mean striding or contractile length for each condition using AnimApp output. Individual larval measurements are plotted over a Tukey boxplot. Statistics: Welch’s two-sample unpaired t-test, *p < 0.05; **p < 0.01; ***p < 0.001.

