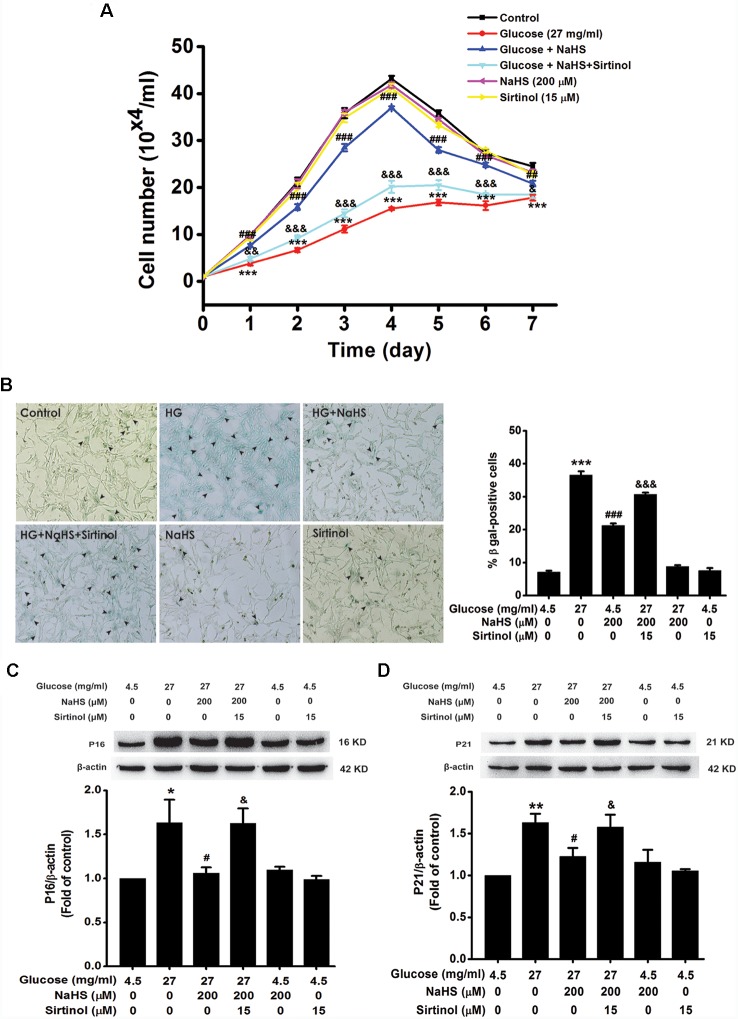
Figure 7.
Sirtinol reversed H2S-inhibited cellular senescence in HG-exposed HT22 cells. (A) Cell growth curves were generated by using Trypan blue stain assays. (B) Representative images of senescent cells that were stained for SA-β-gal (Left, Magnification ×10) and quantitative analysis of the SA-β-gal positive cell (Right). The black arrows indicate the senescent cells. (C,D) The expressions of LC3II/LC3I and P62 in HT22 cells were detected by Western blotting. Values were expressed as the mean ± SEM, n = 3. *P < 0.05, **P < 0.01, ***P < 0.001, vs. control group; #P < 0.05, ##P < 0.01, ###P < 0.001, vs. HG-treated alone group. &P < 0.05, &&P < 0.001, &&&P < 0.001, vs. co-treated with NaHS and HG group.

