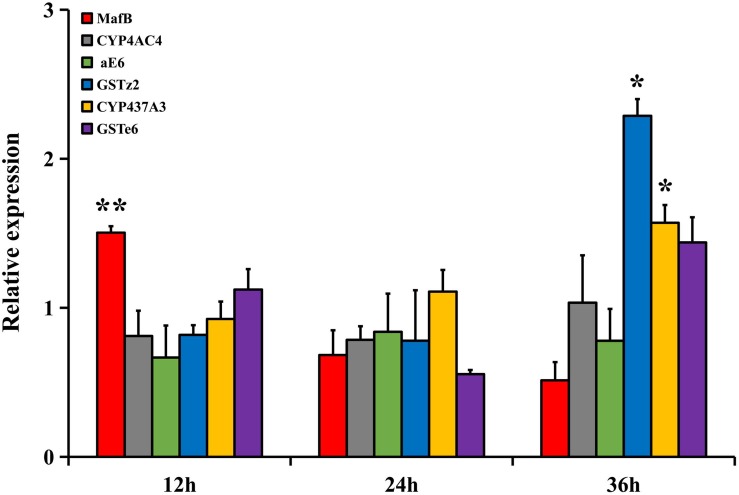
FIGURE 3.
The transcriptional expression profiles of MafB and GSTe6, GSTz2, CYP4AC4, CYP437A3, and aE6 of B. dorsalis in the fat body by abamectin treatment. The data shown are mean ± SE (n = 3). Relative expression was calculated based on the value of acetone. Asterisks (∗ and ∗∗) above the error bars present statistical differences determined by the independent samples t-test with P < 0.05 and P < 0.01, respectively.

