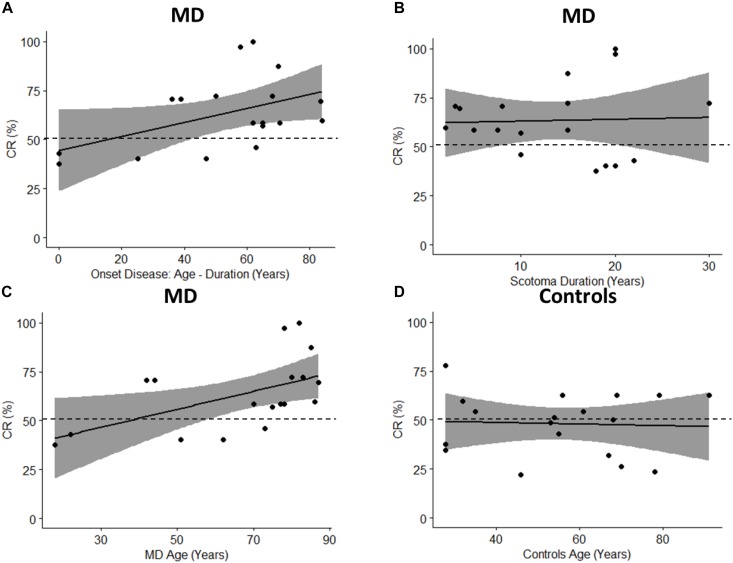
FIGURE 10.
Pearson’s Correlations. The black dots represent data points; the black solid line represents regression line, the black dashed line shows 50% and the gray area show 95% confidence interval. (A) Correlation between onset age (age – duration) and percentage of CR (CR/72 ∗ 100). (B) Correlation between scotoma duration and percentage of CR. (C) Correlation between age of MD group and percentage of CR. (D) Correlation between age of controls group and percentage of CR.

