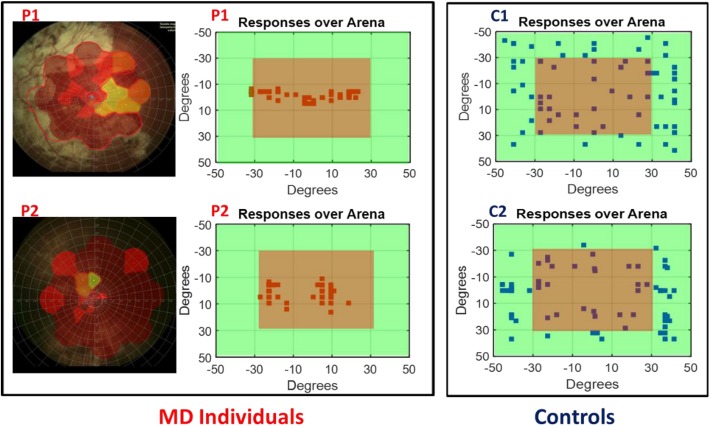
FIGURE 2.
Subject responses. Left, example of retinal maps for two MD individuals (P1 and P2). The central red area indicates the damaged retina, yellow for partially damaged retina, and green for the leftover healthy part of the retina. Center, example of the responses of the same two MD individuals (P1 and P2) for sound localization. Sounds were equally distributed on the surface of the device, but their responses were mainly localized in the central region (in red) indicating the position of their scotoma. Right, example of the responses of two age sighted participants (C1 and C2) for sound localization. Responses are equally distributed on the surface.

