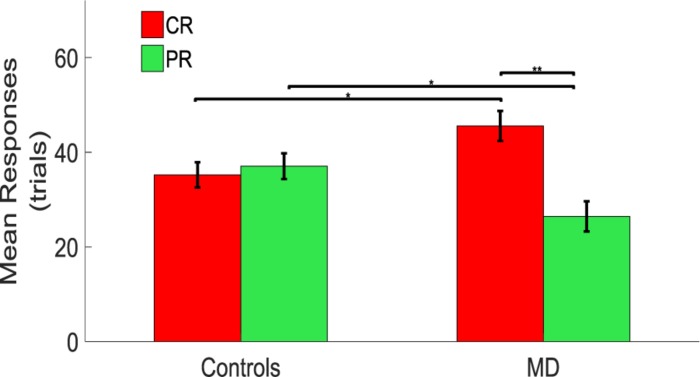
FIGURE 3.
Comparison between controls and MD considering CR and PR. Results show that the MD participants (right side) are more attracted toward the central speakers (red bars). This attraction is higher compared to the one showed by the sighted (left side) which provided responses equally distributed for central and peripheral regions. ∗Significance between groups; ∗∗Significance with-in group.

