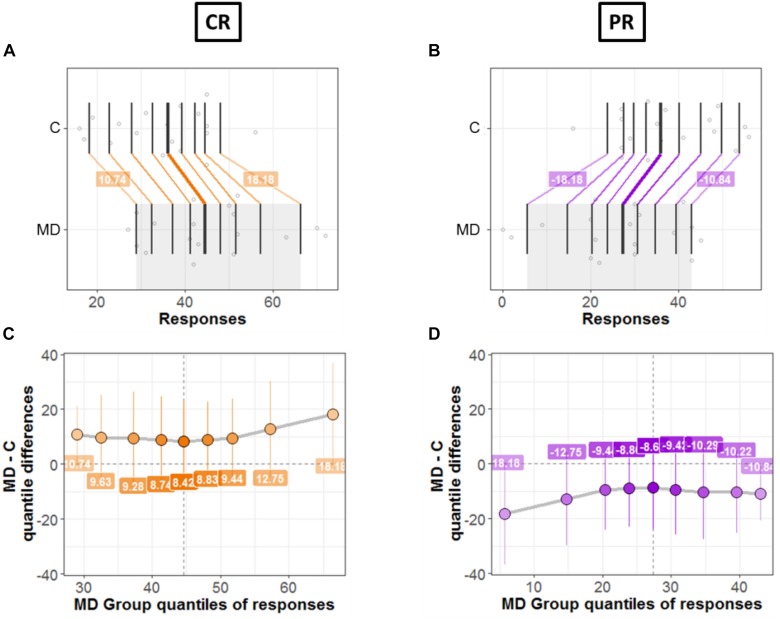
FIGURE 7.
Differences between groups; MD and Controls for CR (left panel) and PR (right panel). (A,B) Strip charts for marginal distributions. Vertical lines mark the deciles for each group with a thicker line marking the median. Among distributions, the colored lines join the matching deciles (orange for positive decile differences and purple for negative values). (C,D) Shift function. Decile differences are shown with MD group deciles on x-axis and decile difference (MD-C) on y-axis. The vertical lines show the 95% bootstrap confidence interval. The first and the last deciles in both figures do not cross zero, hence they are considered significant.

