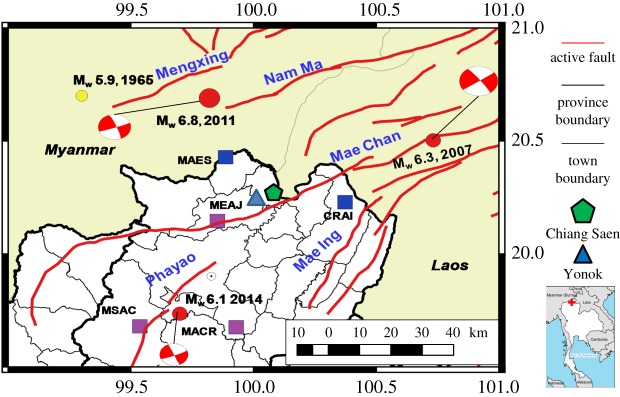
Figure 1.
Chiang Saen and its surrounding seismicity from earthquakes greater than 5.0 since 1902. The red lines represent active faults from the Department of Mineral Resources (DMR) (http://www.dmr.go.th/main.php?filename=fault_en). The blue and purple squares represent seismic stations that record ground motion from Mw 6.8 2011 and Mw 6.1 2014, respectively.

