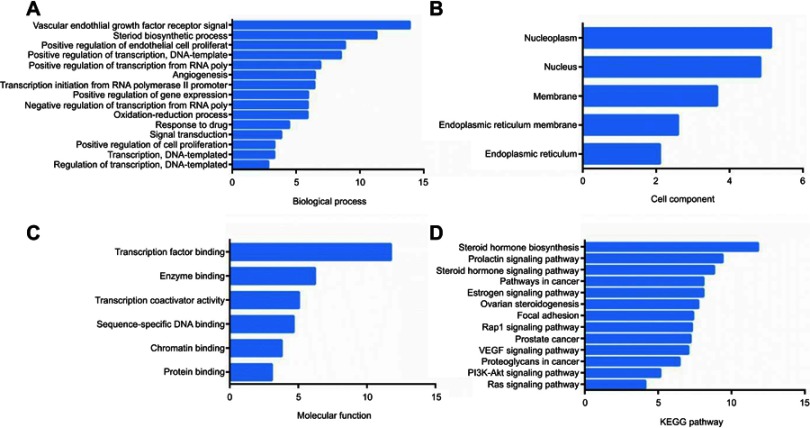
Figure 7.
GO and KEGG analysis of targets. (A) Biological process. (B) Cell Component. (C) Molecular function. (D) KEGG pathway. The y-axis shows significantly enriched categories of the targets and the x-axis shows the enrichment scores of these terms (p<0.01).
Abbreviations: GO, gene Ontology; KEGG, Kyoto Encyclopedia of Genes and Genomes.

