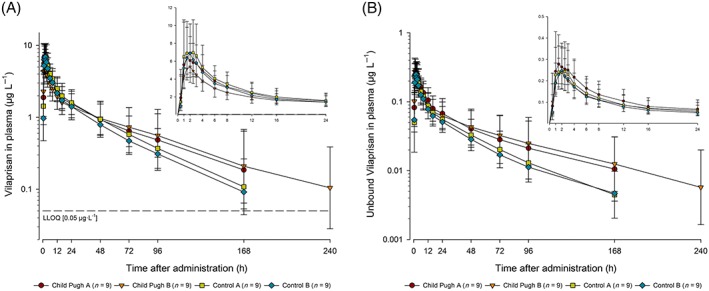
Figure 3.

Total (A) and unbound (B) vilaprisan plasma concentrations (μg L−1) over time after a single oral 2 mg dose administered under fasting conditions in participants with mild (Child–Pugh‐A) or moderate hepatic impairment (Child–Pugh‐B) and matched control participants with normal hepatic function (control mild hepatic impairment, control moderate hepatic impairment). Semi‐logarithmic scale (error bars are standard deviations): Inset: linear scale for the first 24 h postdose. Planned sampling times used. Predose sample was set to 0 hours. lower limit of quantification = 0.05 μg L−1
