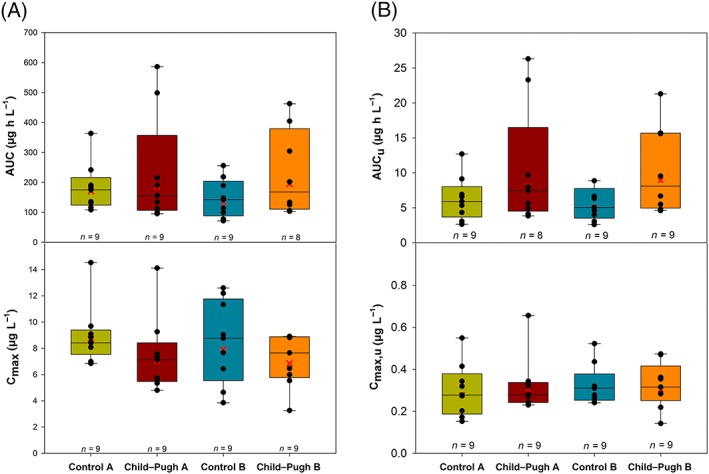
Figure 4.

Vilaprisan total (A) and unbound (B) area under the concentration–time curve (AUC; top) and total and unbound maximum observed plasma concentration (Cmax; bottom) after a single oral 2 mg dose administered under fasting conditions in participants with mild (Child–Pugh‐A) or moderate hepatic impairment (Child–Pugh‐B) and matched control participants with normal hepatic function (control mild hepatic impairment, control moderate hepatic impairment). Vertical line in box represents median, box: 25–75 percentile, vertical lines extend from the box as far as the data extend to, at most, 1.5 times the interquartile range, symbols: individual data
