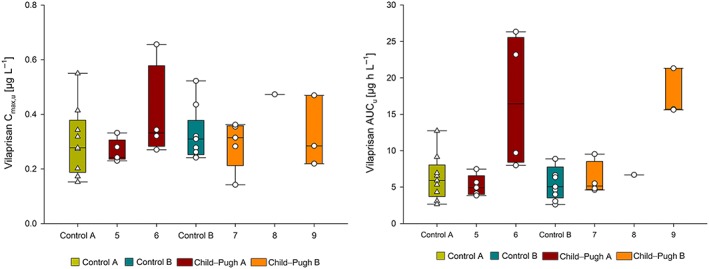
Figure 5.

Vilaprisan unbound maximum observed plasma concentration (Cmax,u; A) and area under the concentration‐time curve (AUCu; B) by Child–Pugh score (CP‐A: 5–6 points, CP‐B: 7–9 points). Vertical line in box represents median, box: 25–75 percentile, vertical lines extend from the box as far as the data extend to, at most, 1.5 times the interquartile range, symbols: individual data
