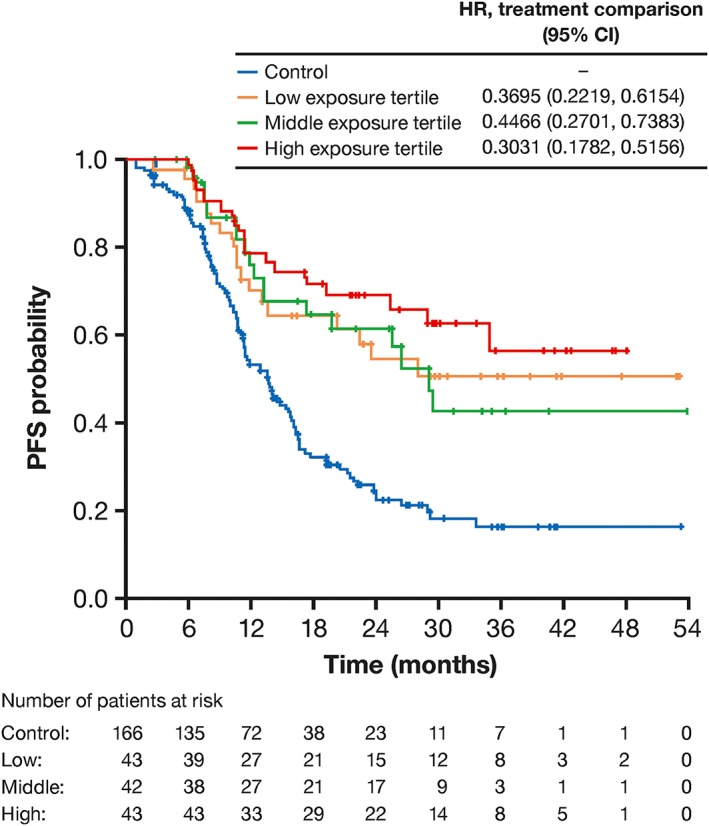
Figure 3.

Kaplan–Meier plot, showing relationship between PFS (n = 128) and obinutuzumab exposure (by tertiles of Cmean) in patients with FL participating in GADOLIN who received at least 3 dosing cycles of obinutuzumab (combined with bendamustine). The upper table shows HR for PFS in obinutuzumab plus bendamustine arm relative to control arm (n = 166; bendamustine monotherapy) from the final CPH model. Cmean tertile ranges: lower, 141–313 μg/mL; middle, 313–400 μg/mL; higher, 400–794 μg/mL. CI: confidence interval; Cmean: mean obinutuzumab exposure over induction period; FL: follicular lymphoma; HR: hazard ratio; PFS: progression‐free survival
