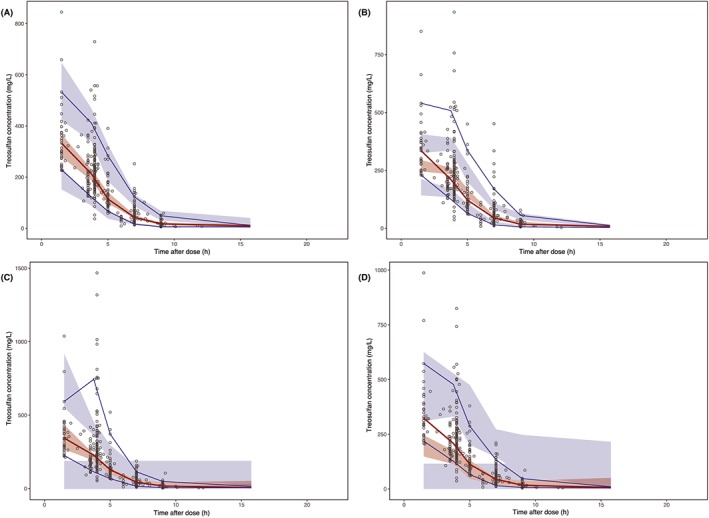
Figure 4.

Prediction‐corrected visual predictive check with median, 10th and 90th observation percentile. The observed treosulfan serum concentrations are shown as open circles. The red and blue lines represent the observed median and 10th and 90th percentile. The shaded areas represent the 95% confidence interval around each of the prediction percentiles. A, Present study, B, Ten Brink et al.17, C, Danielak et al.12, D, Mohanan et al.16
