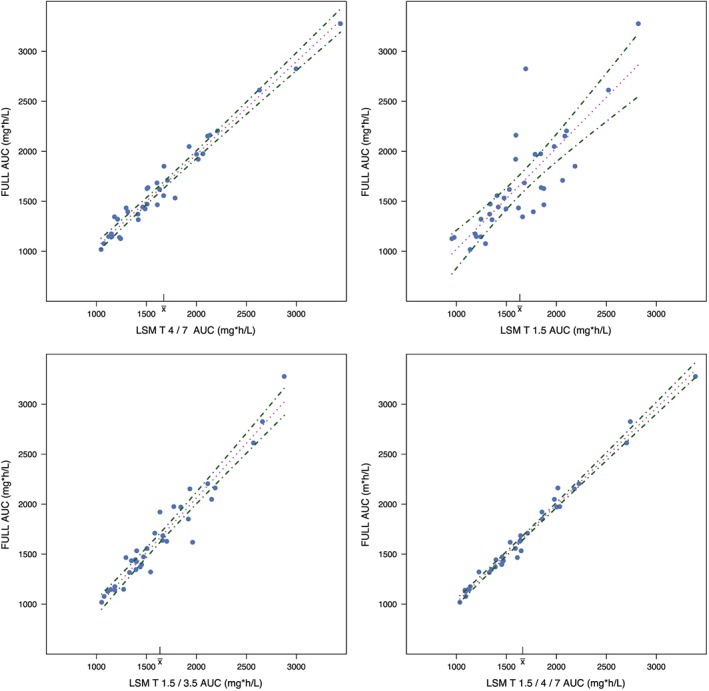
Figure 6.

Regression line (dotted lines) plots of different limited sampling methods with 95% confidence intervals (dot–dashed lines). Upper left: Predictive performance of T = 4 and 7 hours as limited sampling model; upper right: predictive performance of T = 1.5 hours as limited sampling model; lower left: predictive performance of T = 1.5 and 3.5 hours as limited sampling model; lower right: predictive performance of T = 1.5, 4 and 7 hours as limited sampling model
