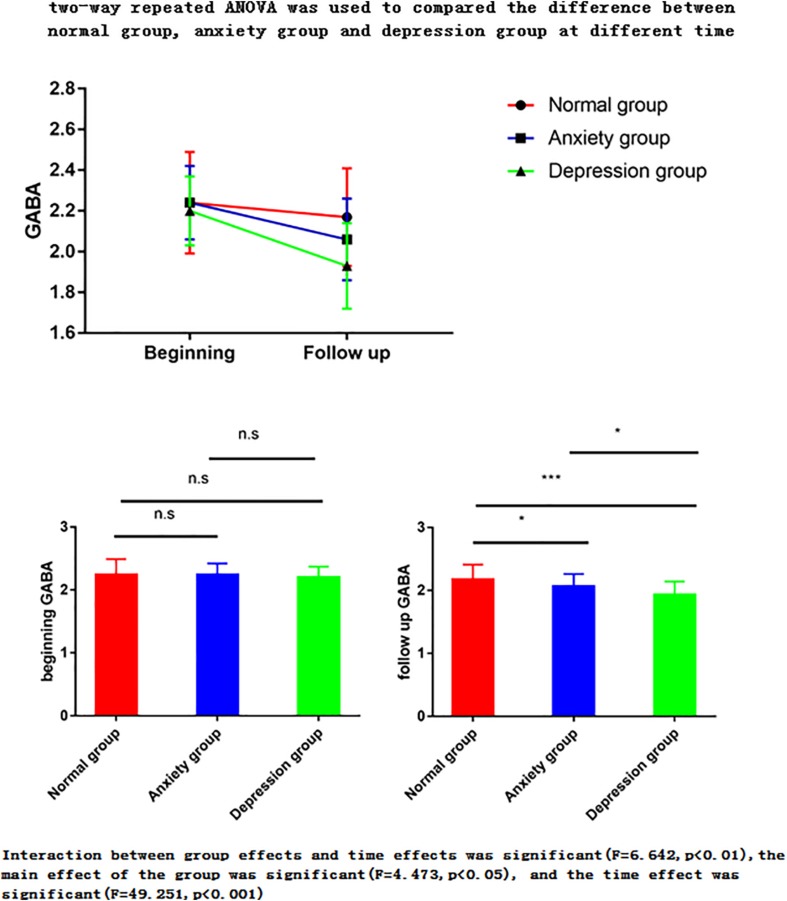
FIGURE 3.
Two-way repeated ANOVA was used to compare the difference between normal group, anxiety group and depression group at different times. The ANOVA for repeated measures is used to perform the data analysis. Interaction between group effects and time effects was significant (F = 6.642, p < 0.01), the main effect of the group was significant (F = 4.473, p < 0.05), and the time effect was significant (F = 49.251, p < 0.001). (1) The main effect showed no statistical difference between any two groups in the three groups at the start time point, but there was a statistical difference between the two groups in the follow-up time point (p < 0.05). (2) The time effect shows that there are differences between the two time points in the normal group, there are differences between the two time points of the anxiety group, and there are also differences between the two time points in the depression group. ∗P < 0.05; ∗∗P < 0.01; ∗∗∗P < 0.001.

