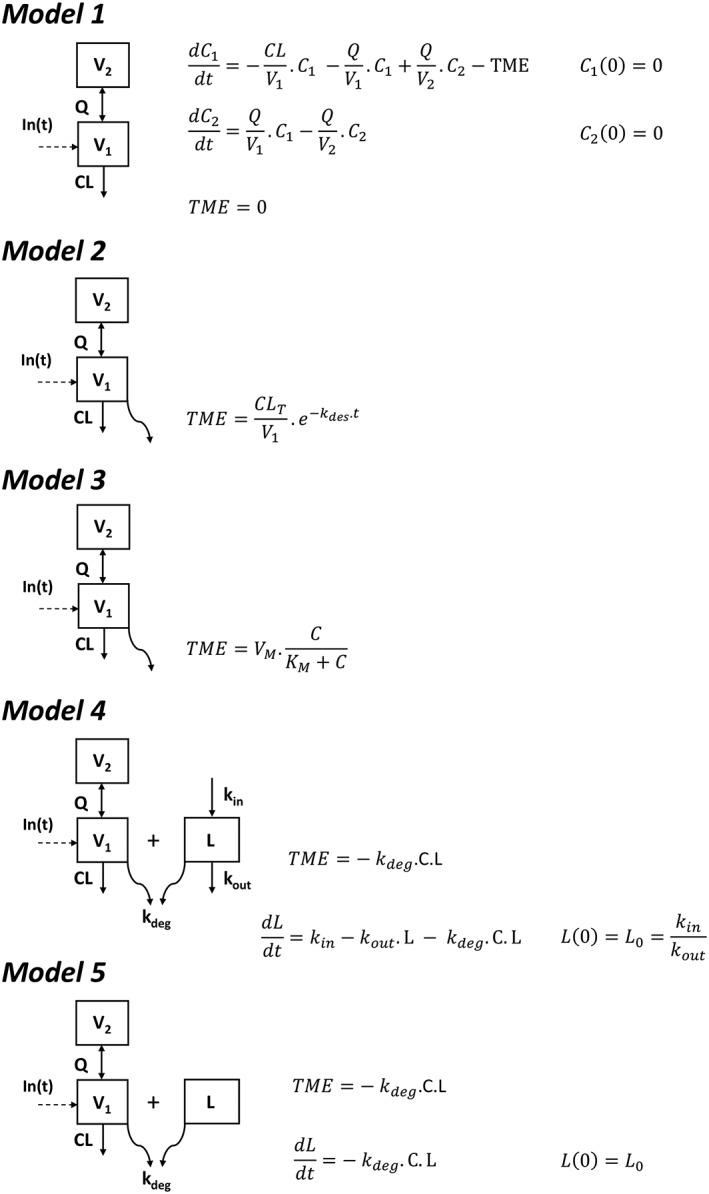
Figure 1.

Pharmacokinetic 2‐compartment models used to describe rituximab pharmacokinetics: linear model with no target‐mediated elimination (model 1), with time‐dependent elimination rate (model 2), with Michaelis–Menten elimination (model 3), with irreversible binding of rituximab to latent target and target turnover (model 4), and irreversible binding of rituximab to latent target with no description of target turnover (model 5). C and L are rituximab concentrations and latent target amount, respectively; V1 and V2 are central and peripheral volumes, respectively; CL and Q are systemic and intercompartment clearances, respectively; TME is target‐mediated elimination; CLT and kdes are initial target‐mediated clearance and its time‐decrease rate constant, respectively; VM and KM are maximum rate and Michaelis constant, respectively; kin, kout and kdeg are latent target input and output and elimination due to its binding on rituximab, respectively
