
Figure 2.
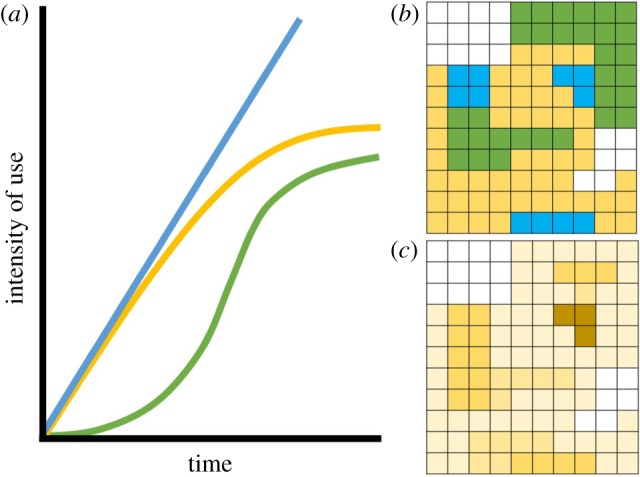
(a) Mirroring functional response in predator foraging behaviour relative to prey density, the intensity of use of specific locations can be assessed in terms of differential temporal patterns. Type I use indicates a consistently used location, such as a den site or water point in an arid environment (blue). Type II use indicates a location where use saturates, such as at point resources that experience denudation with increased use (yellow). Type III use indicates temporally sporadic use, such as seasonal resources that are available intermittently and are denuded quickly (green). (b) Plotting different functional use types on the landscape can elucidate differences in the intensity of use patterns. (c) Contrasting with raw intensity of use data (darker indicates more use) can discern not only how much an area is used, but also the structure in temporal use patterns.