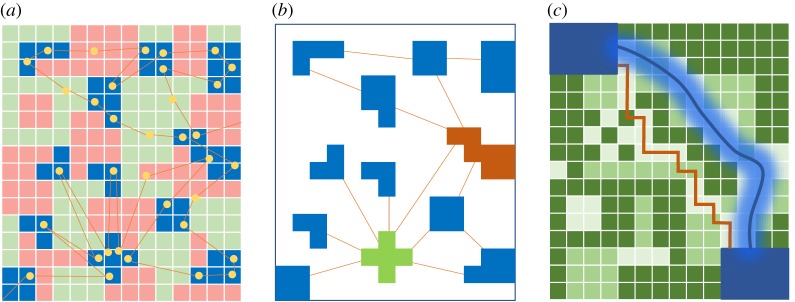
Figure 4.
Structural valuation is based on the importance of a location for the broader landscape context. (a) An animal's movement crosses over different resources on the landscape. (b) Discretizing a landscape into patches (using resource patches or movement properties) can be used to portray the landscape as a matrix. Quantifying connections among patches can be used to derive network metrics—the green patch has a high degree centrality value (key landscape hub) and the orange patch has a high betweenness centrality value (key bottleneck in the network). (c) Resistance surface maps evaluate the cost for animal movement with the darker green representing a higher cost. Optimization approaches highlight different features of the landscape, here portrayed by the orange line representing the movement corridor linking the two blue patches based on a least-cost path approach and the blue line represents an estimation of a likely corridor estimated based on the circuit theory.

