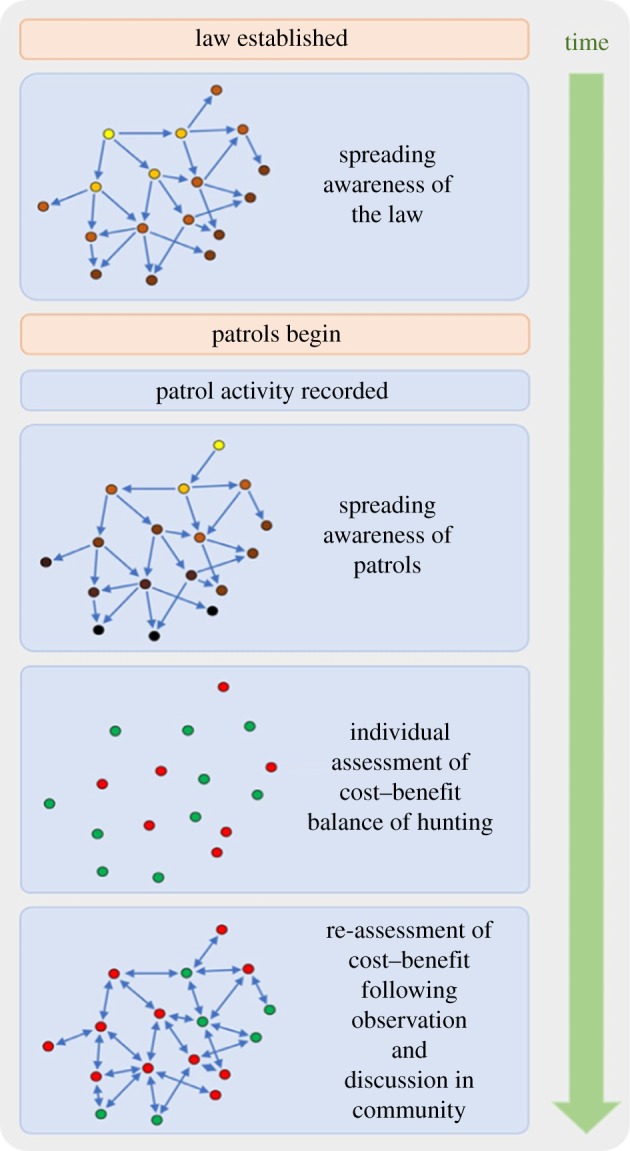
Figure 1.

Flow diagram illustrating a potential series of behavioural processes that might occur following the institution of a statutory hunting prohibition, leading to the community-level response. Blue and beige shapes denote processes occurring within and outside the community, respectively. In the first two large boxes, the darkness of the point colour denotes the order in which the information is received (darker = later). In the other large boxes, green points are those that judge hunting to be cost-effective, and red points those that do not.
