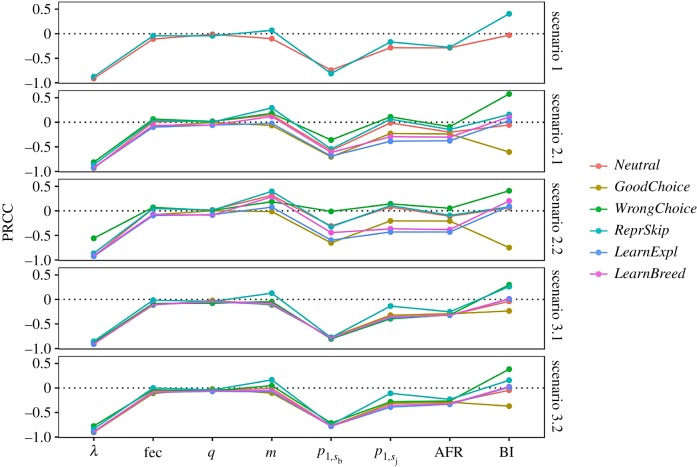
Figure 2.
Sensitivity of the probability of population persistence to life-history traits for different behavioural responses and maladaptive scenarios, based on PRCC. Population persistence is measured as N0P50%, the initial population that give a 50% chance of persistence. Notation not shown in table 1 is as follows: λ is the deterministic grow rate; fec is fecundity expressed as the number of offspring produced annually (m*q); AFR, is the age at first reproduction; BI is the intensity of the behavioural responses, i.e. either moderate or strong. Analyses are based on 3612 combinations of life-history traits distributing species along the fast–slow continuum.

