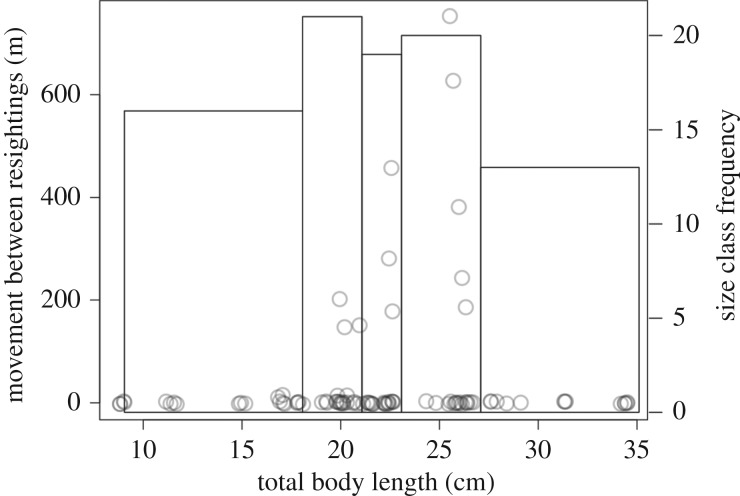
Figure 2.
Frequency distribution of individual movement events (dots, jittered to improve visibility) observed across lionfish body sizes in patch reef habitat in Eleuthera, The Bahamas, showing a trend towards greater maximum movements between resightings at intermediate body sizes. The superimposed histogram (grey lines) represents the frequency distribution of fish sizes across all trips divided into five quintiles, and corresponding to size classes used in the size-selective culling scenarios. Size classes are uneven because size class quintiles were defined based on size class bins containing equal numbers of individual movement events, and there was a greater concentration of movement events for some size classes than others.

