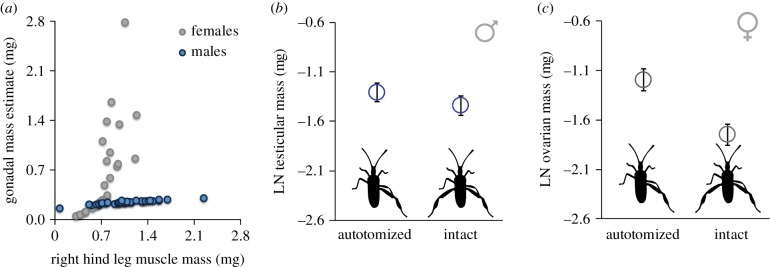
Figure 2.
Both males and females with autotomy showed a positive relationship between the muscle mass of the remaining (right) hind leg and gonadal mass (a), though the slope of this scaling relationship was steeper for females. At the mean overall body size, females (c) received a greater boost in gonadal mass following autotomy than did males (b). In (a), back-transformed raw data (x-axis) and model estimates (y-axis) are displayed, produced from the full (both sexes) model in table 1. We used model estimates of gonadal mass in (a) to adjust for differences in oocyte number within the ovaries which contributed substantially to their mass. In (b) and (c) hollow circles denote estimated marginal means (EMM) ± standard error bars that were generated directly from the same model without back-transformation. EMM produced at the mean body size (loge pronotal width = 1.4215 mg). Simpler models (right columns in table 1) produced qualitatively the same results as depicted here. (Online version in colour.)

