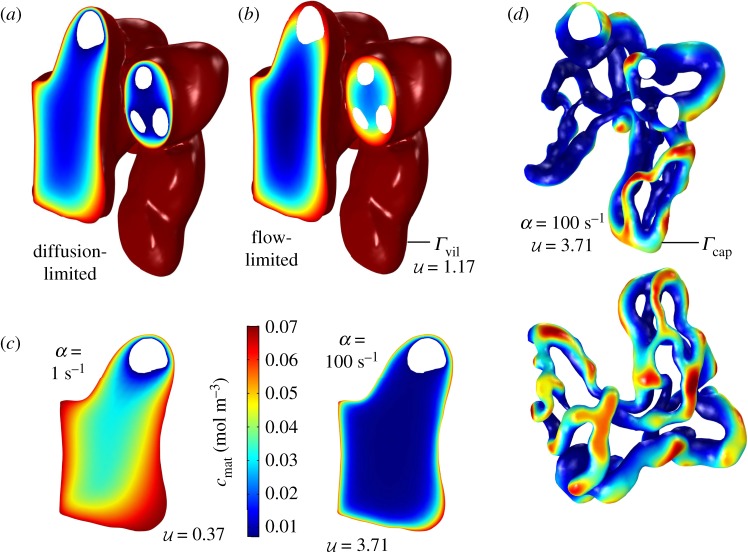
Figure 1.
Features of transport of a generic solute in a terminal villus, assuming first-order kinetics. (a,b) Concentration fields in tissue are shown in a slice through specimen 3 under diffusion-limited and flow-limited conditions at metabolic rate α = 10 s−1. The villous surface is fully oxygenated due to the condition c = cmat on Γvil (shown in dark red). Vessel cross-sections appear as white inclusions. (a) In the extreme diffusion-limited case, c = 0 at the capillary surface, Γcap. (b) In the extreme flow-limited case, at Γcap. (c) Concentration slices (over part of the same surface shown in a, b) for the diffusion-limited case, with uptake rate α ranging over two orders of magnitude. Concentration boundary layers form at the villous surface Γvil as α increases. (d) ‘Hotspots’ emerge with increasing metabolism: only where Γcap and Γvil are in close proximity can solute penetrate to capillaries. The top figure shows the capillary surface Γcap of specimen 3 in the same spatial orientation as panels a, b, with vessel cross-sections shown in white. Colours show the concentration at Γcap for the extreme flow-limited case. The lower panel shows a different projection of the same simulation. (Online version in colour.)

