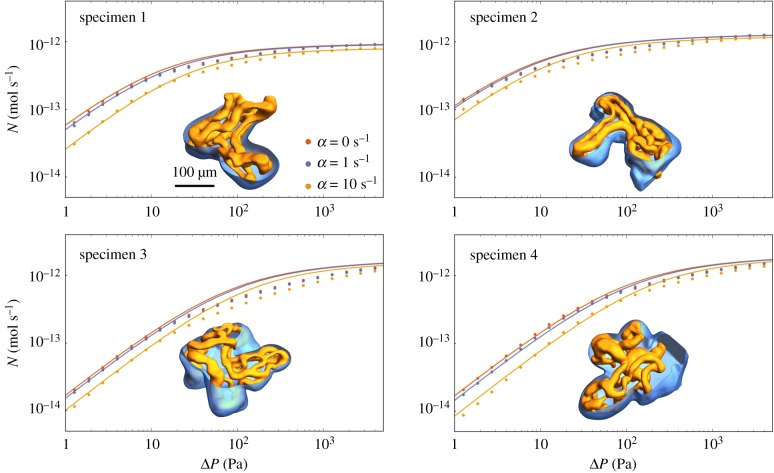
Figure 2.
Symbols show predictions of computational simulations of the full advection–diffusion–uptake problem (appendix A); curves show predictions of the simple regression equation (3.2). The four panels show results for the four vasculatures used in [9]; capillaries and the villous surface are illustrated by insets for each case in orange and blue, respectively. Each panel shows the net uptake N as a function of the inlet–outlet pressure drop ΔP, for no solute uptake (α = 0, identical with fig. 2 in [9]) and increasing uptake (α = 1, 10 s−1; Dt = 1.7 × 10⁻⁹ m2 s−1). (Online version in colour.)

