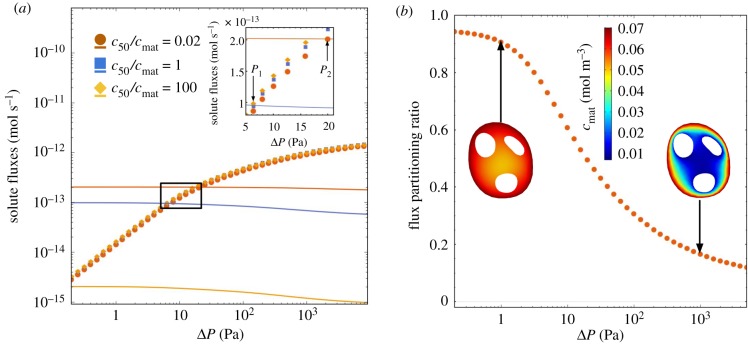
Figure 4.
The effect of nonlinear uptake kinetics on solute transport. (a) The coloured symbols show the solute uptake N which is delivered to the fetus, plotted against the inlet–outlet pressure drop ΔP, for specimen 3. For comparison, the solid lines with matched colours show the solute metabolized by villous tissue for the same specimen. All curves are plotted for the same maximum rate of oxygen metabolism qmax = 0.1 mol/(m3 · s), which we identify as a physiological value in metabolizing tissue (table 1). The different curves show changes in the parameter c50, spanning from predominantly zeroth-order (red symbols and curve) to predominantly first-order (yellow symbols and curve) uptake kinetics. Intersections in the inset, marked P1 and P2, show where the metabolized oxygen flux balances the flux delivered to fetal blood. (b) The flux partitioning ratio Ntissue/Ntotal of the solute flux metabolized by the villous tissue to the total flux of solute entering the terminal villus (for c50/cmat = 0.02; see appendix A). The flux partitioning ratio depends strongly on the flow regime. (Online version in colour.)

