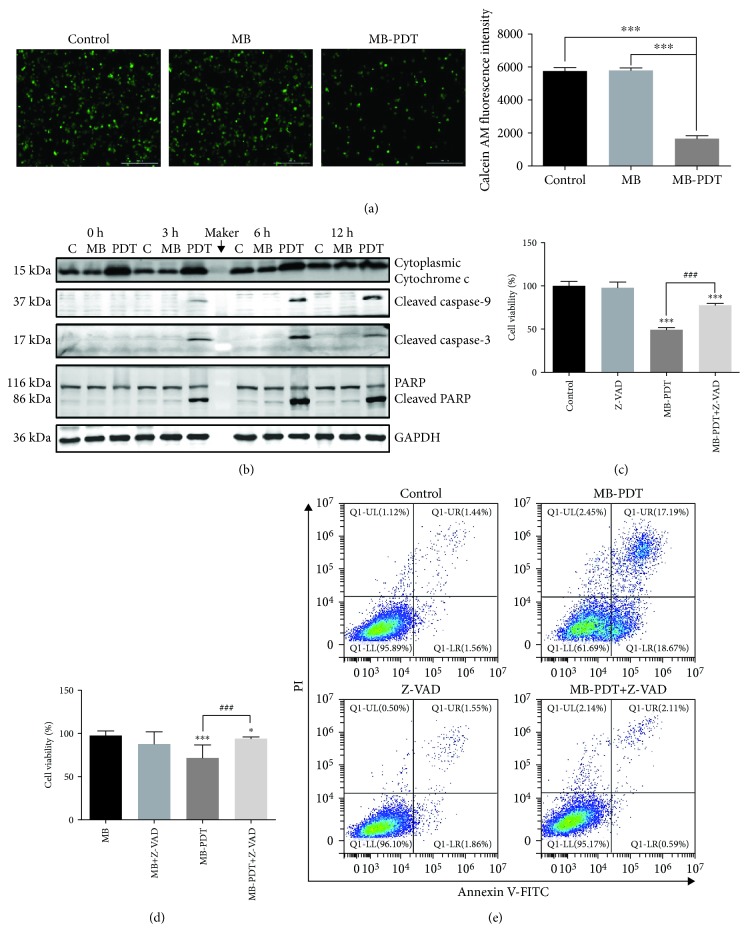
Figure 3.
Release of cytochrome c via opening of the MPTP initiated apoptosis through the intrinsic apoptotic pathway. (a) Fluorescent photomicrograph of MPTP activation via calcein AM/CoCl2+ labeling. The results are expressed as the calcein AM fluorescence intensity. (b) Time-dependent apoptosis was measured in THP-1 macrophages. For this analysis, macrophages were treated with MB-PDT (10 μM, 40 J/cm2) and then harvested at 0, 3, 6, and 12 h post-PDT. The blots were probed with specific antibodies as shown. (c, d) Cell viability was assessed at 24 h in THP-1 macrophages treated with 50 μM Z-VAD-FMK for 1 h, followed by treatment with MB-PDT. The results are expressed as the percentage of viable cells compared with medium alone-treated or MB alone-treated controls (mean ± SD, n = 3). (e) Apoptosis was assessed at 6 h in THP-1 macrophages treated with 50 μM Z-VAD-FMK for 1 h, followed by treatment with MB-PDT. The results are expressed as the percentage of apoptotic cells. ∗P < 0.05, ∗∗P < 0.01, and ∗∗∗P < 0.001. Scale bar = 0.2 mm.

