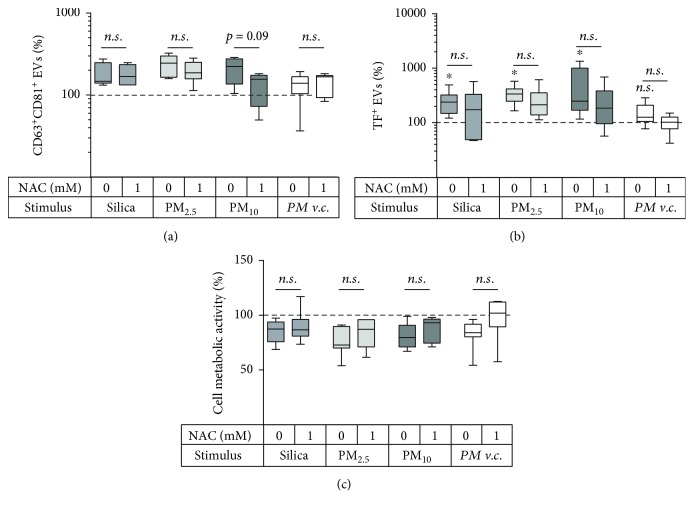
Figure 4.
Effect of 1 mM NAC on EV release and cell metabolic activity during the exposure of BEAS-2B cells to silica (100 × 106 μm2/cm2) or PM (1.5 m3/ml). Release of (a) CD63+CD81+ EVs, n = 5‐9 and (b) CD63/CD81/CD9+TF+ EVs, n = 6‐7. (c) Cell metabolic activity as determined by the MTT assay, n = 5‐8. The box and whisker plots show the median (line in the box), 25th and 75th percentiles (outer lines of the box), and minimal and maximal values (whiskers). ∗ p < 0.05 compared to the unexposed control (100%).

