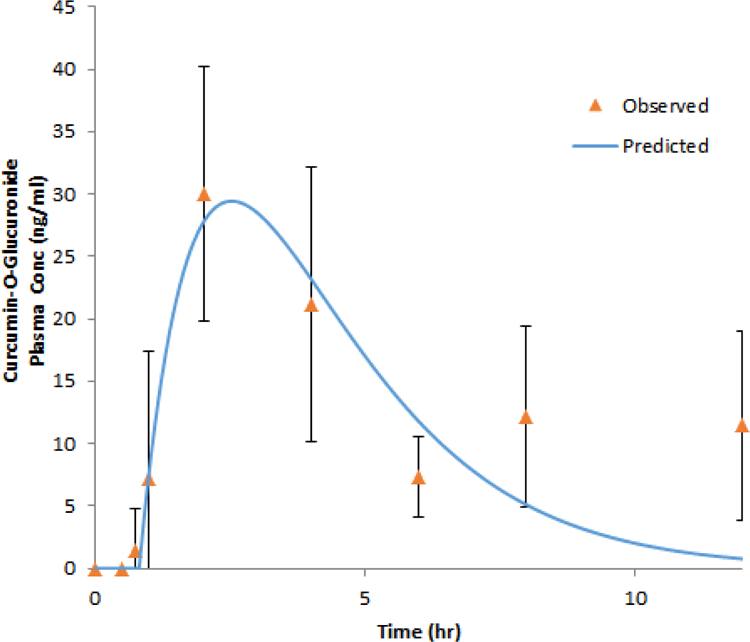
Figure 2. Plasma concentration-time profile of curcumin-O-glucuronide.

Concentration-time profile of curcumin-O-glucuronide (COG) as described by a one-compartment model. Experimental observation data are shown as the mean +/− SD and the solid line represents the Phoenix WinNonlin model predicted curves after a 4 g oral dose of curcumin to 12 healthy subjects.
