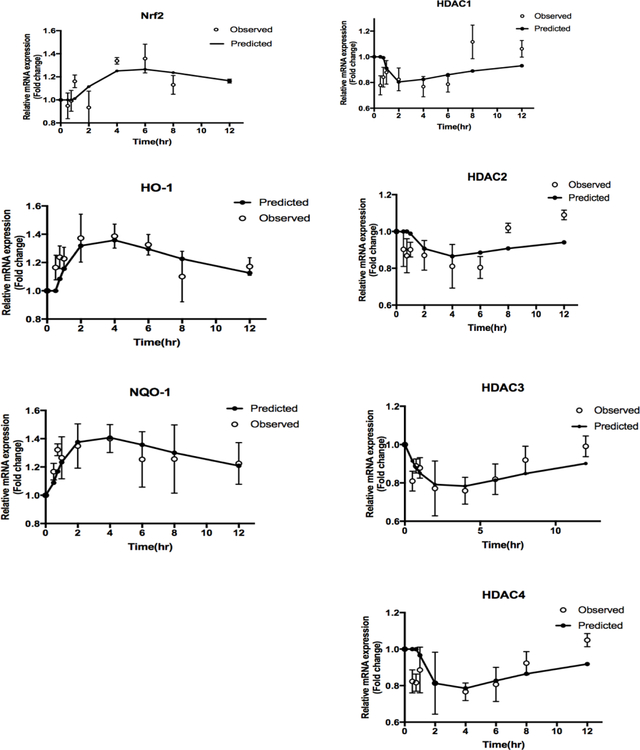
Figure 4. Antioxidant and epigenetic gene expression changes as described by indirect response model.
Phase II anti-oxidant and Epigenetic gene expression, including NRF2, HO-1, NQO1, and HDACs (1, 2, 3, 4) as described by the designated IDR model. The open circles represent the mean of the observed data in rat leukocytes, and the black lines represent the model prediction.

