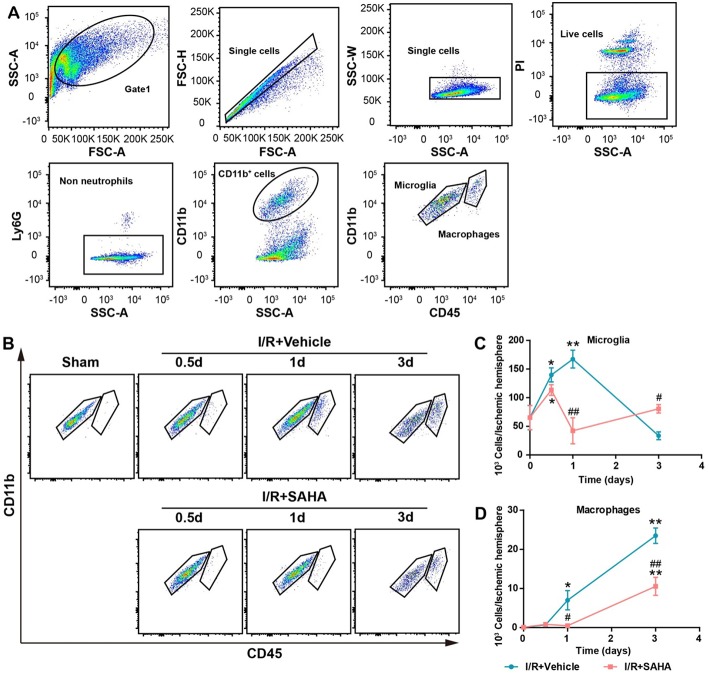
Figure 5.
Effects of SAHA treatment on microglia activation and macrophage infiltration in the ipsilateral hemisphere of tMCAO mice. (A) Representative dot plots depicting the gating strategy of neutrophils (Ly6G+), resident microglia (Ly6G−CD11b+CD45medium), and macrophages (Ly6G−CD45highCD11b+) from the mononuclear cells isolated from the ipsilateral hemispheres of 3 d tMCAO mouse. Dead cells were first excluded from single cells. (B) Representative dot plots showing the effects of SAHA treatment on the temporal changes of microglia and macrophages at 0.5, 1, and 3 d after the onset of brain ischemia. The temporal dynamics of microglia (C), macrophages (D) at 0.5, 1, and 3 d after I/R. *p < 0.05; **p < 0.01, compared with Sham group. #p < 0.05; ##p < 0.01 compared with I/R + vehicle group. n = 4–6/group/time point.

