Figure 1.
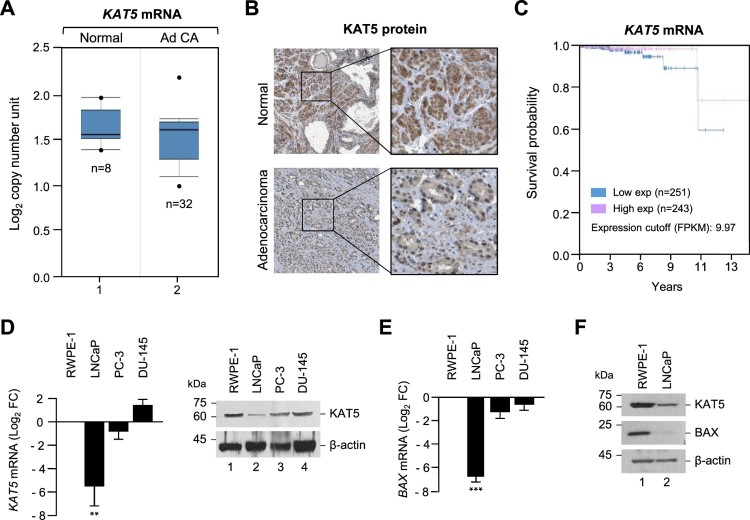
KAT5 expression was downregulated in human prostate cancer cells. (A) The gene expression data set from the Oncomine database showed that KAT5 genes were under-expressed in prostate cancer tissues (adenocarcinoma) compared with normal prostate tissues. (B) KAT5 protein expression levels in prostate cancer tissues (adenocarcinoma) and normal tissues were visualized by immunohistochemistry using anti-KAT5 antibodies. Data obtained from The Human Protein Atlas. Bar indicates 100 μm. (C) Kaplan-Meier survival curves were plotted using KAT5 gene expression levels. Data obtained from Kaplan-Meier Plotter. (D) KAT5 mRNA and protein expression were detected by RT-PCR and Western blotting in the normal cells or various cancer cells. Results represent the mean ± SEM of three biological experiments performed in triplicate. Statistical significance was determined by Student’s t-tests (***, p < 0.001, **, p < 0.01). (E) Bax mRNA expression detected by RT-PCR in the normal or various cancer cells. (F) Bax protein levels in the normal or prostate cancer cells (adenocarcinoma). KAT5 and Bax mRNA or protein levels were normalized using β-actin.

