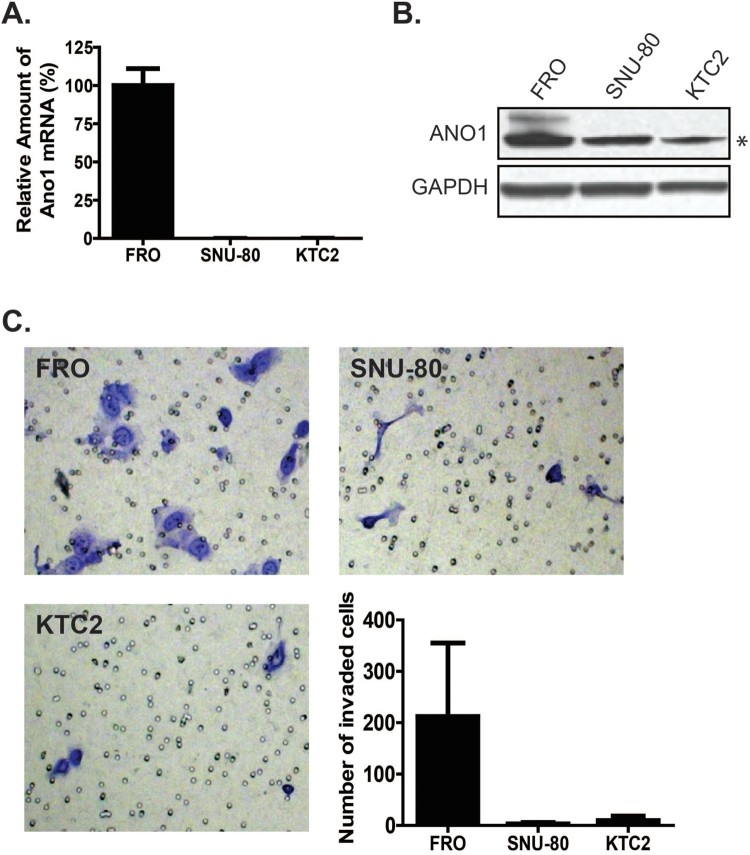
Figure 2.
ANO1 expression in anaplastic thyroid carcinoma (ATC) cell lines. (A) qRT-PCR data showed that ANO1 expression was high in FRO cells. (B) Western blot analysis. ANO1 protein expression was observed in FRO cells (upper band). Lower band (asterisk) was non-specific protein. (C) Cell invasion assay. Stained cells indicate cells that transmigrated across the Matrigel-coated transwell insert. The graph shows the number of migrated cells for each cell line. Among the ATC cell lines examined in this study, the number of migrated cells showed the following trend: FRO > KTC2 > SNU-80.

