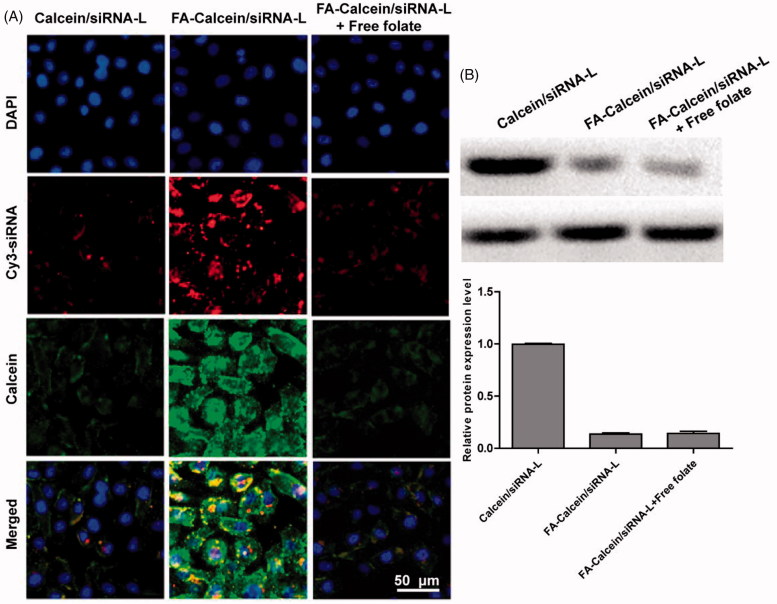
Figure 2.
(A) In cellular uptake of Bmi1 siRNA and Calcein by FA-Calcein/siRNA-L in the KB cells. Bmi1 siRNA was labeled with Cy3 (red) and Calcein emits green fluorescence by itself. The nucleus was counterstained with DAPI (blue). (B) Western blotting assay of folate receptor protein expression in KB cells that treated with different formulations.

