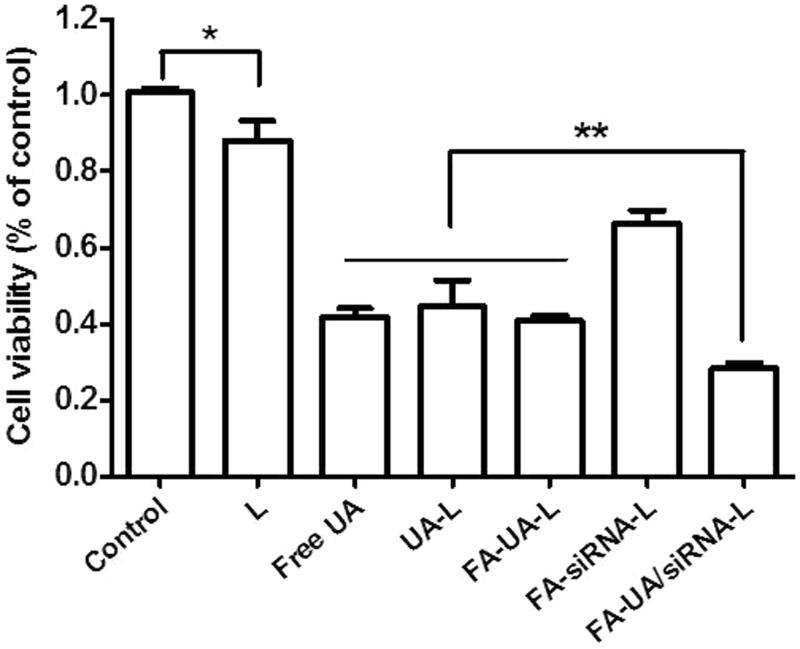
Figure 4.
Cell viability of KB cells incubated with the different formulation with the final Bmi1 siRNA concentration of 100 nM and UA concentration of 50 uM. Data are shown as mean ± SEM of 3 independent experiments. The statistical significant difference between two groups was defined as. *p < .05; **p < .01.

