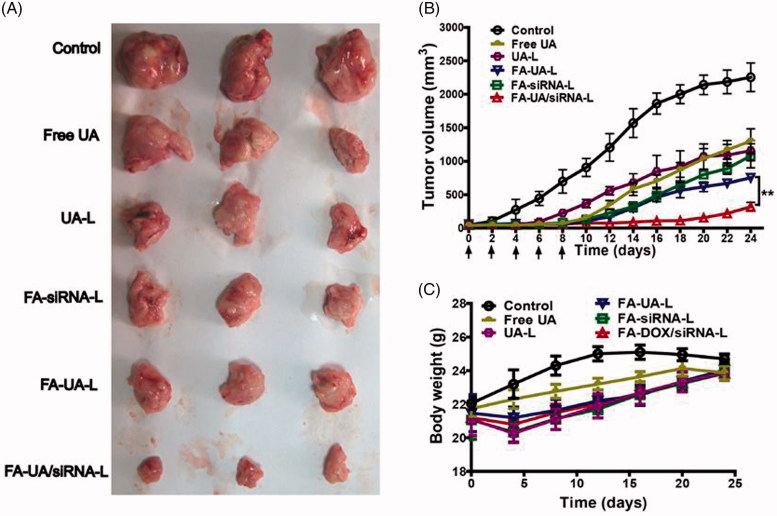
Figure 6.
Anti-tumor efficacy of FA-UA/siRNA-L and the other formulations in the xenograft mouse model. (A). Tumor tissues obtained from mice that sacrificed on the 25th day. (B). Growth curves of tumor volume determined during the treatment of saline, free UA, UA-L, FA-siRNA-L, FA-UA-L, and FA-UA/siRNA-L. Three per group of mice were respectively given i.v injection of different formulations by doses of 170 μg siRNA/kg, 4.5 mg UA/kg every other day for five times. The statistical significant difference between two groups was defined as. **p < .01. (C). Body weight changes curves of mice by the treatment with saline, free UA, UA-L, FA-siRNA-L, FA-UA-L and FA-UA/siRNA-L. Data are expressed as mean ± SD (n = 6).

