Abstract
Purpose:
Implement and evaluate a 3D MRI method to measure temperature changes with high spatial and temporal resolution and large field of view.
Methods:
A multiecho pseudo-golden angle stack-of-stars (SOS) sequence with k-space weighted image contrast (KWIC) reconstruction was implemented to simultaneously measure multiple quantities, including temperature, initial signal magnitude M(0), transverse relaxation time and water/fat images. Respiration artifacts were corrected using selfnavigation. KWIC artifacts were removed using a multibaseline library. The phases of the multiple echo images were combined to improve proton resonance frequency precision. Temperature precision was tested through in vivo breast imaging (N = 5 healthy volunteers) using both coronal and sagittal orientations and with focused ultrasound (FUS) heating in a pork phantom using a breast specific MR-guided FUS system.
Results:
Temperature measurement precision was significantly improved after echo combination when compared with the no echo combination case (spatial average of the standard deviation through time of 0.3–1.0 and 0.7–1.9°C, respectively). Temperature measurement accuracy during heating was comparable to a 3D seg-EPI sequence. M(0) and values showed temperature dependence during heating in pork adipose tissue.
Conclusion:
A self-navigated 3D multiecho SOS sequence with dynamic KWIC reconstruction is a promising thermometry method that provides multiple temperature sensitive quantitative values.
Keywords: MRgFUS, thermometry, stack of stars, KWIC
INTRODUCTION
MR imaging provides excellent soft tissue contrast and when used to guide focused ultrasound (FUS), provides the ability to localize, plan, monitor and verify treatments (1). FUS has been used to noninvasively treat uterine fibroids as well as breast, prostate, liver and brain cancer (2–5). As FUS can locally heat tissue very quickly, at rates greater than 1°C/s, the monitoring of treatments (6,7) requires a high spatial and temporal resolution. Also, because the energy is delivered from a large transducer aperture to a small focus, a large field of view (FOV) is required to monitor any possible energy deposition away from the focus. The FUS beam will likely travel through several different tissue types during treatment where a portion of the beam will be reflected and transmitted at each tissue interface depending on the impedance difference between the tissues. Each tissue type will also absorb a different amount of the ultrasound energy. For example, 90% of the ultrasound energy through the skull is reflected or absorbed (8).
Monitoring of interventional treatments can be done using 2D or 3D MRI sequences where the method chosen is often governed by the trade-off between the needed temporal and spatial resolution and required FOV. Currently, clinical monitoring of MR-guided FUS (MRgFUS) treatments is limited to a single (or relatively few) 2D slices (2,3,9–13) providing a limited FOV. For example, 2D monitoring of the ultrasound focus during transcranial MRgFUS treatments is severely limited and can miss heating outside of the slices monitored, such as near the skull surface, in grating lobes, or in any points of unintended energy deposition due to beam aberration (14).
MR temperature imaging does have some limitations, which are more apparent when using 2D imaging such as partial volume effects, which cause temperature underestimation (15). These effects can be reduced using smaller voxels and band-limited (sinc) interpolation (15), but these options are not readily available in 2D MRI which has slices that are thicker and interpolation cannot be used in the through slice direction. Furthermore, it can also be difficult to properly position a single 2D slice to capture the entire focus and to limit slice crosstalk, multiple 2D slices often have a gap between each slice where any temperature changes will not be measured. Respiration and motion artifacts will also introduce errors to the temperature monitoring.
3D MR thermometry can overcome many of the FOV, partial volume, and coverage gap limitations, which are inherent in 2D imaging but unfortunately, standard 3D sequences typically require too much time to acquire k-space to be clinically viable. Temporal resolution can be increased by methods involving undersampling, such as temporally constrained reconstruction (16), model predictive filtering (17), Kalman filtering (18), parallel imaging (19), or using a sequence designed for increased speed such as segmented echo-planar imaging (seg-EPI) (20,21)
While a 3D seg-EPI offers several advantages, it has limitations. The chemical shift artifact, field inhomogeneity, and field variation due to motion artifacts are increased due to the low bandwidth in the phase encoding direction. The chemical shift typically requires imaging with fat saturation, while the respiration artifact can be corrected to a limited extent depending on the orientation of the 3D slab (22). Increasing the EPI factor, or number of lines collected per TR, will increase the temporal resolution while further escalating the chemical shift and respiration artifacts and decreasing the signal-to-noise ratio (SNR). Seg-EPI sequences also typically have image distortions along the phase encode direction.
Non-Cartesian 3D sequences, such as stack of stars (SOS) and stack of spirals (23), have several advantages that have been explored for use in thermometry. Projection sampling performs well with high levels of under-sampling. The center of k-space is sampled every TR providing robustness to motion, as well as the ability to correct respiration artifacts through self-navigation (24). Projection sampling can take advantage of the oversampled central region of k-space to artificially increase the temporal resolution while maintaining the high spatial resolution by using k-space weighted image contrast (KWIC) (25,26). Using a golden angle (GA) increment improves the ability for angular undersampling, as a GA increment guarantees an optimal projection angle distribution for an arbitrary number of projection angles, and the irrational nature of the GA also lends itself to compressed sensing (27). It has been shown that the GA is also an optimal radial projection order when using KWIC (28), as it allows for arbitrary temporal resolution and temporal update rate. Combining radial sampling with Cartesian slice encoding in SOS sequences allows for 3D imaging with these advantages (29). The temporal resolution can be further increased by taking advantage of partial Fourier sampling in the slice direction (30).
While the implementation of non-Cartesian sampling trajectories have historically had some difficulties, these issues have been largely overcome. Off-resonance artifacts produce blurring instead of uni-direcitonal shift, but a more uniform field and increased readout bandwidth can help decrease the blur (29). Errors in the gradient timing can produce significant artifacts, but several correction methods have been successfully implemented (29,31–33). Finally, efficient algorithms and computer hardware can significantly reduce the computation time required to grid the non-Cartesian measurements onto a Cartesian grid (34,35).
Many regions of the body have significant amounts of adipose tissue near where interventional treatments are performed (e.g., breast, uterus), which can affect image quality. The strength of the chemical shift artifact and SNR are both related to the readout bandwidth. As the readout bandwidth is decreased, the SNR and chemical shift artifact will both increase. A simple method to maintain SNR while decreasing the chemical shift artifact is to increase the readout bandwidth and acquire multiple echoes (36,37). The individual echoes will have lower SNR; however, data from each echo can be combined to increase the overall SNR of both the magnitude and phase information (38–40). Acquiring multiple echoes has the added benefit of allowing calculation of and the initial signal magnitude, M(0), as well as separate water/fat images. T2 has been shown to have a linear relationship with temperature in adipose tissue and has been used as a measure of temperature to monitor near field heating (40,41). The signal magnitude also varies with the equilibrium magnetization and T1, both of which change with temperature (6,42).
In this work, we present and evaluate a new 3D multi-echo SOS sequence for use in MRI thermometry with pseudo-golden angle (PGA) sampling and KWIC temporal weighting to simultaneously provide multiple quantitative measurements [proton resonance frequency (PRF) shift temperature, M(0), and ]. Unlike the GA increment, which never repeats, the PGA has the advantage that the projection angle repeats after a fixed number of increments, allowing a trajectory matching baseline subtraction for improved temperature measurement accuracy. We demonstrate that 3D multi-echo SOS with PGA simultaneously provides high spatial and temporal resolution measurements, measures and corrects respiration artifacts through self-navigation, and provides water/fat separation. The KWIC reconstruction algorithm and quantitative measurements are described in detail. Four possible methods of phase determination and baseline subtraction for calculating PRF temperature change from multi-echo PGA SOS image volumes are presented. The precision of each quantitative measurement from the sequence and KWIC reconstruction method were tested in breasts during a nonheating situation. The sequence and KWIC reconstruction were also applied during MRgFUS heating in aqueous and adipose ex vivo pork tissue.
METHODS
Sequence and Data Acquisition
A 3D multiecho SOS spoiled gradient echo sequence was modified such that the angle increment between projections was the PGA, θ = (1 − 233/377)* 360° ≈ 137.56°. The PGA is based on the ratio of two Fibonacci numbers and will cause the k-space trajectory to repeat exactly after 377 projections. For each excitation, all echoes were acquired at the same projection angle and with a bipolar gradient readout. This was repeated for all kz phase encodings before incrementing by the PGA. Sampling the center of k-space each TR (Fig. 1a) allowed for self-navigated respiration correction as described in the Respiration Correction section.
FIG. 1.
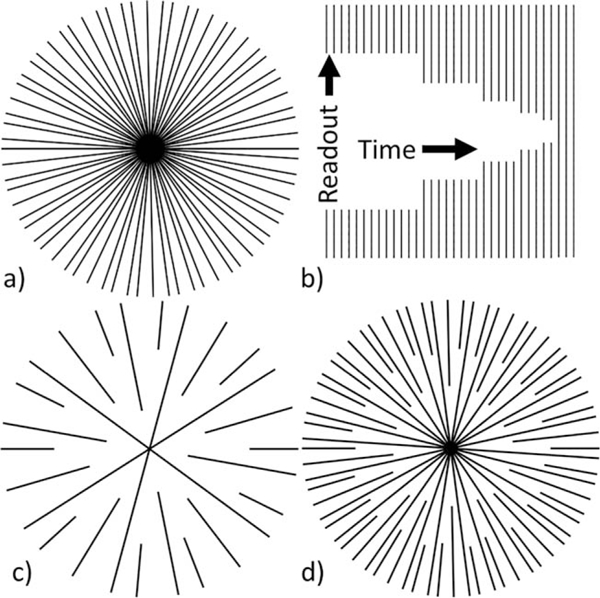
a: Example of fully sampled PGA k-space with 34 projections. b: Asymmetric KWIC window with 3 center and 34 outermost projections. c: Example of k-space sampling using KWIC with 3 center and 13 outermost projections. d: Example of k-space sampling using KWIC with 8 center and 34 outermost projections.
Image Reconstruction
The KWIC algorithm with a sliding KWIC reconstruction window was implemented to generate images with an effectively high temporal resolution (25,26) with the PGA sampling pattern. The PGA projection increment guarantees a nearly uniform distribution of projection angles for any arbitrary number of projections. By using a sliding window, an arbitrary number of time points with arbitrary temporal resolution can be reconstructed. The optimal KWIC reconstruction window used with GA is described by Winkelmann et al (28), where the difference in aliasing effects between uniformly distributed radial projections and GA sampling is minimized when the number of projections included in the reconstruction is equal to a Fibonacci number. The effective temporal resolution of images reconstructed using the KWIC algorithm is the time covered by the center of k-space. KWIC reconstructed images maintain the high spatial resolution data from the outer portions of k-space. The overall signal contrast and relatively low resolution of the FUS heating are contained in the central region of k-space and are updated much more frequently than the high frequency region, which changes more slowly.
The properties of the sampling pattern and the KWIC reconstruction window used in this work are illustrated by the simplified examples shown in Figure 1. The fully sampled set of projections in Figure 1a is one of several acquired, each with the same set of projections that increment by the PGA. For each time frame reconstructed, a window, such as shown in Figure 1b, is used to select the measurements for reconstruction. The window was asymmetric in time, placing the center of k-space at the end of the temporal window, thereby ensuring that the majority of the image information comes from the most recently acquired data. For the example window in Figure 1b, the last three lines pass through the center of k-space. The first outer ring adds two additional lines giving five total lines in that ring, and the next ring adds three lines giving eight, and so on in such a way that each ring contains a Fibonacci number of projections and is most uniformly distributed.
Figure 1c shows the sampling pattern for 13 outermost projections and 3 central projection. Figure 1d shows 34 outermost projections with 8 central projections. In general, the number of KWIC rings and the radius of each ring is determined by the number of projections included through the center and outermost rings. The angular spacing within each ring depends on the total number of projections included in the window. Including fewer projections will not only increase the overall temporal resolution, but will increase the angular spacing of projections within each ring (example, Fig. 1c). Thus, there is a tradeoff between the temporal resolution and undersampling artifacts, as shown in Supporting Figure S1, which is available online. Increasing the number of projections through the center simply increases the radius of the innermost ring (example, Fig. 1d). The required total number of projections and number of projections through the center to accurately reconstruct the image will change with the necessary image FOV, and spatial and temporal resolution to accurately represent the temperature change.
The KWIC window used to reconstruct nearly all KWIC images in this work had 13 projections in the center, and each successive ring used the next higher Fibonacci number of projections up to 377 in the outermost ring. The outer radius of each ring (as a fraction of the total radius) was determined by the ratio of the number of projections in the ring and the number in the outermost ring: (13, 21, 34, 55, 89, 144, 233, 377)/377 = (0.035, 0.056, 0.09, 0.146, 0.236, 0.382, 0.618, 1). The sliding window was advanced 13 projections between each reconstructed time point. After the KWIC filter and density compensation were applied, the data were regridded using nufft (34) (available at http://web.eecs.umich.edu/~fessler/irt/irt). Besides density compensation, each projection was equally weighted. When using a GA or PGA projection increment with KWIC, the relative distribution of k-space points remains unchanged in subsequent time frames, but the entire distribution rotates about the center, as shown in Supporting Video S1. This causes any artifacts from regridding to change spatially between reconstructed time points.
For reference, a temporal series of time images reconstructed with various sizes of the sliding KWIC window is shown in Supporting Video S1. By incrementing with a PGA that repeats every 377 projections, and advancing the sliding window by 13 projections, the k-space distribution rotation will repeat after 29 reconstructed time frames. This allows a trajectory-matched baseline library, based on the 29 rotations of the k-space distribution, to be used in temperature difference calculations. The KWIC window was applied after respiration correction and to each echo separately. All images were reconstructed offline using MATLAB (Mathworks, Natick, MA).
Respiration Correction
The respiration correction method used is the same as described in Svedin et al (22), except the phase variation is measured using self-navigation from the center of k-space instead of separate navigator readouts. The slice Fourier transform was applied before respiration correction was performed, thus each slice was corrected separately. The phase of the center of k-space as a function of TE was unwrapped using Equation [1].
| [1] |
where pn is the complex value at the center of k-space, and is the phase of the nth echo. This unwrapping method works as long as the phase increment between echoes is less than Respiration phase offsets were measured by linearly fitting the slope of the phase at the center of k-space from the multiple echoes as a function of TE using linear regression. Each measurement coil will measure a different inherent non-zero phase slope due to spatial variation in B0 between sensitive volumes. This inherent phase slope was removed by averaging the measured slope over multiple respiratory cycles to obtain a baseline (nonvarying) slope and subtracting the baseline from each measurement for each coil independently. The first 377 projections were arbitrarily chosen for the baseline as it would cover multiple respiratory cycles. This method also measures and corrects for weighted average B0 field drift for each coil (weighted by the coil sensitivities).
After removing the baseline phase, the remaining measured phase slope variation is primarily due to respiration motion. This measurement through the center of k-space assumes a spatially uniform off resonance from respiration. While this is not entirely true, as it has been shown that the B0 offset varies spatially (43), using an array of coils does provide some spatial sensitivity to the off-resonance measurement. The phase of each echo was adjusted to remove the variation in phase due to respiration at their individual read time in the echo train as described in Svedin et al (22). This method will have minimal effect on the accuracy of temperature induced phase shifts so long as the size of the temperature change region is small compared with the sensitive volume (44).
Coil Combination
Multicoil data were combined using a slightly modified version of Roemer’s equation (45). The magnitude information was combined using the standard Roemer’s equation (Eq. [24] in Roemer et al.) (45), which is reproduced here in slightly different notation as Equation [2], where the complex image value is used instead of the complex sensitivity for each coil
| [2] |
where M is the combined magnitude image data, pj and pk are the complex image data using KWIC from coils j and k, and is the inverse noise covariance. This coil combination results in an optimal combination of magnitude information, although it contains no phase information. The phase information can also be optimally combined using a slightly modified version of Equation [2] by replacing the complex image value, with a complex phase reference. A fully sampled set of images, fp, was reconstructed without a KWIC window using the first 377 projections, to minimize undersampling artifacts, to be used as a reference phase for the phase information coil combination. The complex data from the first echo for each coil were used as the reference phase for each echo and for each reconstructed time point, as this will preserve the phase evolution with TE. The phase information was combined using the modified Roemer’s equation shown in Equation [3],
| [3] |
where fpk,ref is the fully sampled complex reference data from coil k. By combining the phase information from each coil using a reference phase, the resulting data are a phase difference from the reference phase. The magnitude and phase information were recombined through Equation [4]
| [4] |
The fully sampled multiple coil images were also combined to be used later for water/fat separation.
Thermometry Calculations
PRF temperature difference calculations were made using four different methods for comparison. The first method, referred to as single echo first baseline (SE-FB), simply calculated the PRF temperature difference using each echo’s phase independently and the first KWIC reconstructed time image as the reference phase for subtraction. The second method, referred to as single echo trajectory-matched baseline (SE-TB), also calculated the difference for each echo independently, but used a trajectory-matched baseline library, where the reference phase is from the image where the k-space distribution was in the same rotation as the current image. The third method, combined echo first baseline (CE-FB), calculated the temperature change using the combined echo phase, described in the next paragraph, using the first reconstructed time image as the reference phase, and the fourth method, combined echo trajectory-matched baseline (CE-TB), used the combined echo phase and a trajectory-matched baseline library determined by the rotation of the k-space distribution. The PRF temperature change, ΔT, from the reference time is defined as (6)
| [5] |
Where is the phase of the current image is the phase of the reference image at a known temperature γ is the gyromagnetic ratio, α is the PRF change coefficient of −0.01 ppm/°C and B0 is the magnetic field strength.
The phase data from each echo were combined to improve temperature precision using a weighted linear least squares fit of the phase as a function of echo time as shown in Equation [6],
| [6] |
Where is the initial phase of pixel x at TE = 0 ms, β(x) is the slope of the phase change, is the measured phase of the xth pixel at the jth TE, and σ2 is the variance of the phase at each pixel x for the jth TE. The variance of the phase is proportional to one over the magnitude squared,
| [7] |
making the combined phase simply weighted by the magnitude squared.
| [8] |
The solutions for a and b in Equation [8] are derived in Appendix A. The phase information was unwrapped along the echo dimension using Equation [1] before calculating the fit. Once a and b were obtained, the optimal phase combination was calculated for the same TE as the last acquired echo using Equation [A5].
M(0) and were also calculated from the multiple echoes. Assuming monoexponential decay, the signal magnitude in the presence of noise has the form
| [9] |
where M(x, TEj) is the signal magnitude from the xth pixel at the jth TE and C(x) represents the effective noise variance at the xth pixel. The offset value of C(x) can be estimated using the magnitude values and is derived in Appendix B. The value of C(x) was estimated from the solution given in Equation [B10], and then subtracted from the square of Equation [9], which was then linearized to give
| [10] |
A weighted linear least squares fit of the natural log of the magnitude is shown in Equation [11]
| [11] |
The variance of the magnitude is also proportional to one over the magnitude squared,
| [12] |
making Equation [11] also weighted by the magnitude squared.
| [13] |
Equation [13] has the same form as Equation [8] and has the same solutions for a and b which are derived in Appendix A by replacing with ln An example displaying the fits resulting from whether or not C is accounted for when fitting is shown in Figure 8a. M(0) and are obtained from a and b by
| [14] |
FIG. 8.
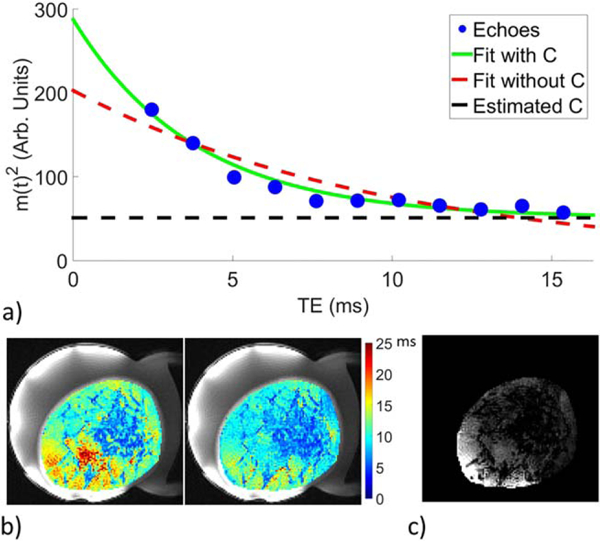
a: Example of SOS multi-echo exponential decay with weighted linear least squares fit to data removing offset C (green line) and without removing offset C (red dashed line). b: Example of measurements within the breast without removing C (left) and with removing C (right). The values within aqueous and adipose tissue are more uniform after removing the offset C. c: Example of the measured offset value C within the breast.
Variations in M(0) and were measured as a percent change using two methods. First, as a difference from the first time frame and second, as a difference from the trajectory-matched baseline k-space distribution time frames.
Experiments
To demonstrate the ability of the multi-echo PGA SOS sequence to measure temperature changes, two types of experiments were performed. The first evaluated the precision of temperature measurements in in vivo breast during nonheating conditions, and the second experiment evaluated the sequence during MRgFUS heating in a pork phantom. All experiments were performed in a Siemens Prisma 3T MRI scanner (Siemens Healthcare, Erlangen, Germany) using a breast-specific MRgFUS system with an integrated eight-channel RF coil and an MRI-compatible phase array transducer (256 elements, 1 MHz frequency, 10 cm radius of curvature; Imasonic, Besançon, France and Image Guided Therapy, Pessac, France) (46–48). All human studies were approved by the local Institutional Review Board and were performed with informed consent.
In Vivo Breast Nonheating Experiments
Five healthy female volunteers (age range: 20–51 years) were recruited for nonheating experiments. Each volunteer was positioned in the breast-specific MRgFUS device. After localization, multiecho PGA SOS images were acquired in both the coronal and sagittal orientations while the volunteer was free breathing. In each orientation, images were acquired with three different sets of imaging parameters (different TR, number of echoes, number of slices) to assess the effectiveness of each. The first image set had the following parameters (voxel size = 1.3 mm isotropic; FOV = 208 × 208 × 20.8 mm; matrix = 160 × 160 × 16; 1000 radial projections; flip angle = 10°; repetition time (TR) = 20 ms; echo time (TE) = 2.46 + 1.29 * n, n = 0 to 10 ms; readout band-width = 1080 Hz/pixel; 5/8 partial Fourier in slice direction). The second set of images were acquired using the same imaging parameters except with only the first 6 echoes and TR =11 ms. The third set of images had the same TR/TE as the second set, but acquired twice as many slices with the same isotropic resolution (FOV = 208 × 208 × 41.6 mm; matrix = 160 × 160 × 32).
The first 20 radial projections from each image set were discarded to ensure the sequence was at steady state before reconstruction. Each image set created 47 reconstructed time points. The effective temporal resolution of each image set was 2.60, 1.43, and 2.86 s, respectively. A single set of images was reconstructed without a KWIC window using the first 377 projections to minimize undersampling artifacts for use in creating a fat/water mask. Separate water/fat images were generated from the first three echoes of the images reconstructed without the KWIC window using the 3-point Dixon method (49).
Temperature difference calculations were made using the four methods as described above in the Thermometry Calculations section. Using a mask from the separated water/fat images the standard deviation through time of temperature in each aqueous tissue voxel was calculated for each of the four methods described above for each volunteer. The average of these aqueous tissue voxel standard deviations was calculated for each method for each volunteer for each echo time. The mean standard deviations for the last echo of each of the four methods were compared for statistical difference using a one-way analysis of variance (ANOVA) with a P-value threshold of 0.05. To determine the relative precision of the four methods, the voxel-wise difference between the standard deviation from the last echo of the SE-TB, CE-FB, CE-TB methods and that from the SE-FB method were compared. The average difference value was determined for each paired comparison to quantify the improvement over the SE-FB method and the same ANOVA statistical test as above was used.
The effect of respiration correction was quantified for the CE-TB method by subtracting the PRF precision values calculated without correction from those with correction for each aqueous voxel. The spatial average of the standard deviation from the combined echoes was also calculated as a function of the number of echoes included in the weighted linear least squares fit. M(0) and were calculated using the weighted linear least squares method described above and including only the in phase echoes to minimize errors from signal changes that are not described by the exponential decay model in Equation [9], such as the signal from a mixture of water and fat which would move in and out of phase. The percent change in M(0) and were measured as described above. The standard deviation through time of M(0) and differences were calculated for both of the difference calculations.
MRgFUS Phantom Experiments
The sequence was evaluated during FUS heating conditions using a pork belly sample that contained significant amounts of both fat and aqueous tissues. The phantom was positioned in the same breast-specific MRgFUS system that was used to image the volunteers. The 3D imaging volume was prescribed in a coronal orientation with the same imaging parameters as the second set of in vivo images (TR = 11; 6 echoes) and 1905 radial projections (for all sampled kz) were acquired. This resulted in 117 reconstructed time frames. The phantom was sonicated with 25 acoustic W for 40 s. The pork phantom was sonicated in two locations, one in aqueous and the other in adipose tissue. PRF temperature measurements were calculated using the four methods and M(0) and differences were also calculated as described in the Thermometry Calculations section. For comparison, image sets were acquired during identical sonications using a seg-EPI sequence with the following parameters (voxel size = 1.3mm isotropic; FOV = 208 × 152.1 × 20.8mm; matrix = 160 × 117 × 16; flip angle = 20°; TR = 44 ms; TE = 14 ms; EPI Factor = 9; readout bandwidth = 1020 Hz/pixel; 6/8 partial Fourier in slice direction). PRF temperature measurements for the seg-EPI sequence were calculated using the first time frame as the reference. The relative temporal resolution for the two sequences were 1.43 and 6.86 s/image volume for the SOS and seg-EPI sequences, respectively.
RESULTS
The central slice of the separate water/fat images generated from the SOS sequence are shown in Figure 2 for volunteer 2 in both the coronal and sagittal orientations. Images for each volunteer are shown in Supporting Figure S2. As expected, the amount and distribution of aqueous tissue varied between volunteers. An example of the PRF temperature precision in aqueous tissue for each of the four calculation methods is shown for volunteer 2 in Figure 3. Figure 4 shows the PRF standard deviation maps for each volunteer in both orientations using the CE-TB method. Figure 5 shows the PRF standard deviation maps with and without respiration correction for volunteer 4 using the CE-TB method. The average improvement for each volunteer is shown in Supporting Figure S3 and are comparable to the improvement observed in (22). The average improvement across the volunteers for image set 1 was 24.4 ± 6% and 62.3 ± 14% for the coronal and sagittal orientations, respectively.
FIG. 2.
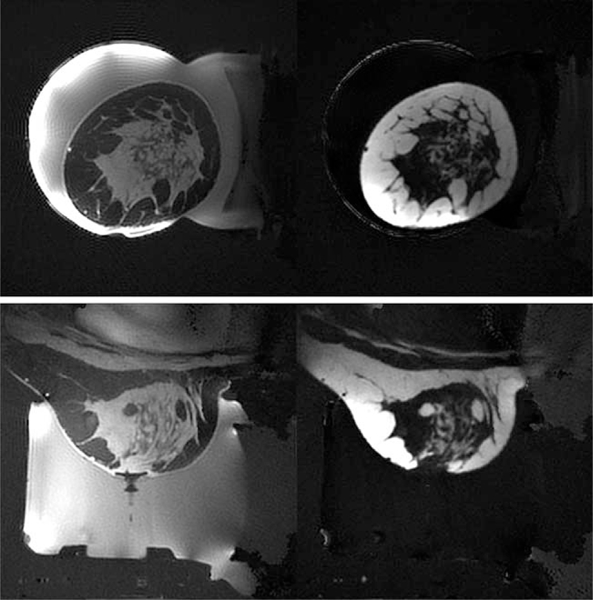
Separated water (left) and fat (right) images for in vivo breast coronal (top row) and sagittal (bottom row) for volunteer 2. Separated water and fat images for each volunteer are shown in Supporting Figure S2.
FIG. 3.
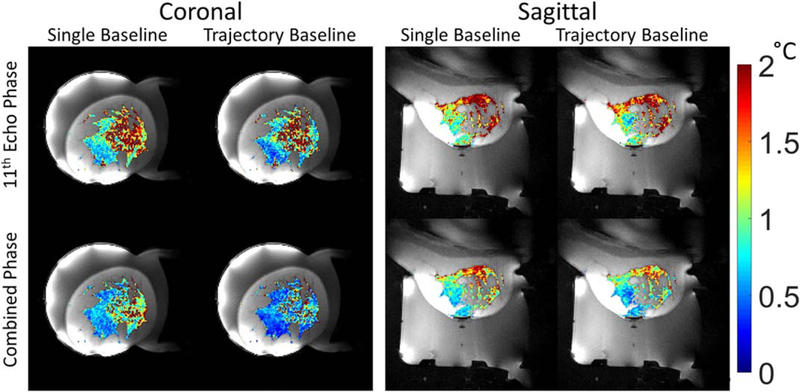
Standard deviation through time maps of PRF temperature in aqueous tissue for the four calculation methods for volunteer 2. Left column: first image used as phase reference. Right column: trajectory-matched baseline images. Top Row: PRF temperature calculated from the last echo. Bottom row: PRF temperature calculated from the combined phase.
FIG. 4.
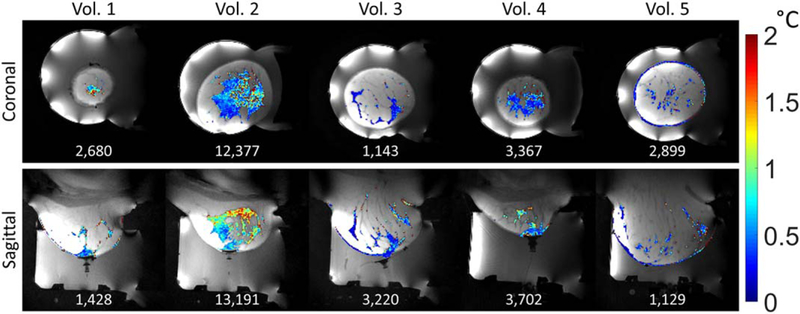
Standard deviation through time maps of PRF temperature in aqueous tissue for each volunteer using the CE-TB method and image set 1. The total number of aqueous voxels for each image orientation and volunteer is displayed at the bottom of each image.
FIG. 5.
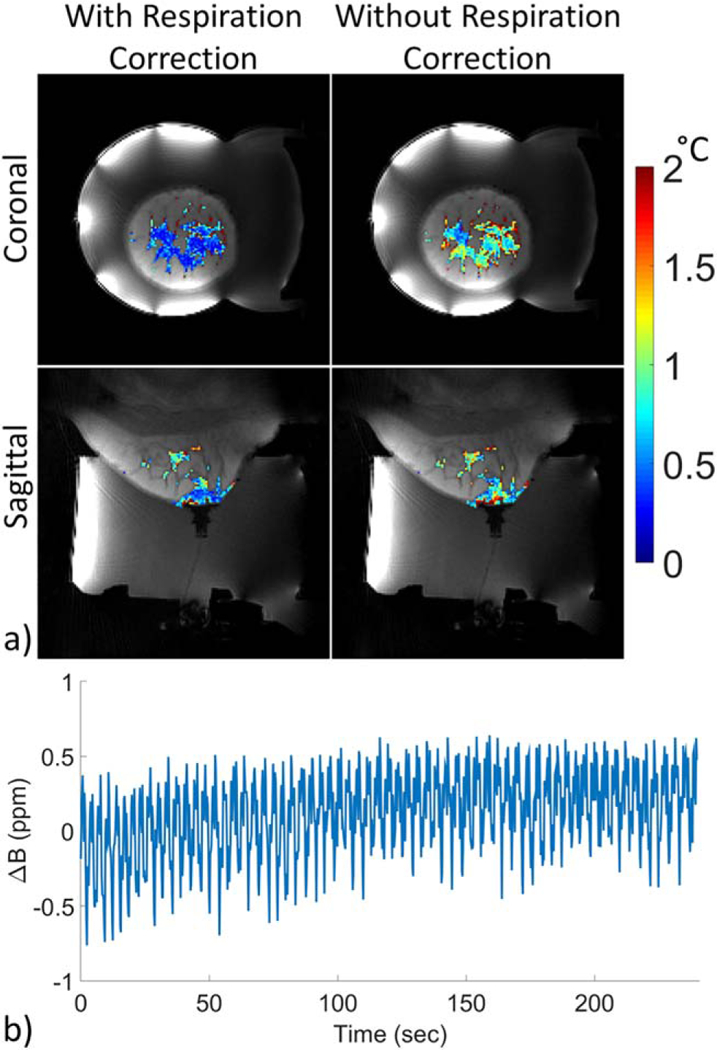
a: Standard deviation through time maps of PRF temperature in aqueous tissue with (left) and without (right) respiration correction for volunteer 4 using the CE-TB method and image set 1. b: Example of measured field shift in the central slice of the image set 1 coronal acquisition for volunteer 4.
Figure 6 displays the spatially averaged PRF standard deviation for volunteer 3 as a function of TE for image set 1 in both coronal and sagittal orientation for each of the four methods. The combined echo phase data only include the echoes up to and including the displayed TE. Figure 7 shows the spatially averaged PRF standard deviation values for each volunteer for each of the four methods at the last TE from image set 1 in both coronal and sagittal orientation. For nearly every case, there was a statistically significant difference between each of the methods. The CE-TB method had the highest spatial average precision in both coronal and sagittal orientations for all three image sets and volunteers in all but one case (Image Set 3, Coronal, Volunteer 2). It should be noted that the error bars in Figure 7 are not a true standard error, as the variation present is not solely due to noise and has spatial location dependence (e.g. distance from coils and respiration). Supporting Figure S5b shows the average improvement in the precision compared with the SE-FB. For nearly every case, there was a statistically significant difference between each of the improvements.
FIG. 6.
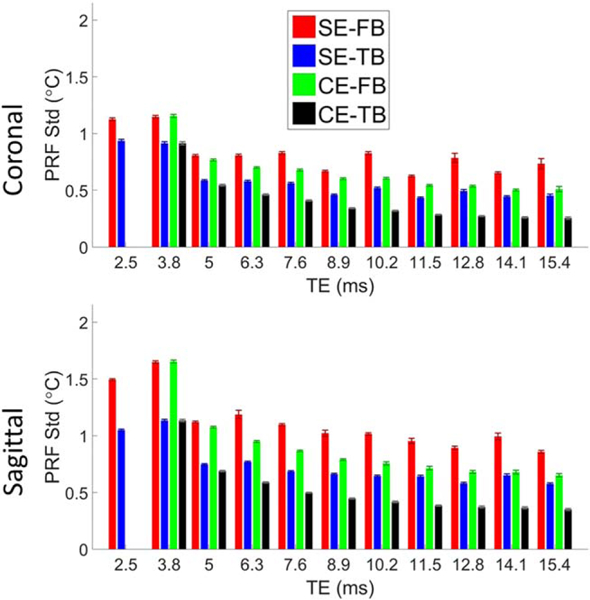
Spatially averaged PRF standard deviation as a function of TE in aqueous tissue in the breast for volunteer 3 and image set 1. Errors bars are the standard error of the average PRF standard deviation for each echo image volume. PRF temperature calculated using the SE-FB (red), SE-TB (blue), CE-FB (green), and CE-TB (black) methods. The combined phases (CE methods) only used the echoes up to and including the displayed TE. Data for image sets 2 and 3 are included in Supporting Figure S4.
FIG. 7.
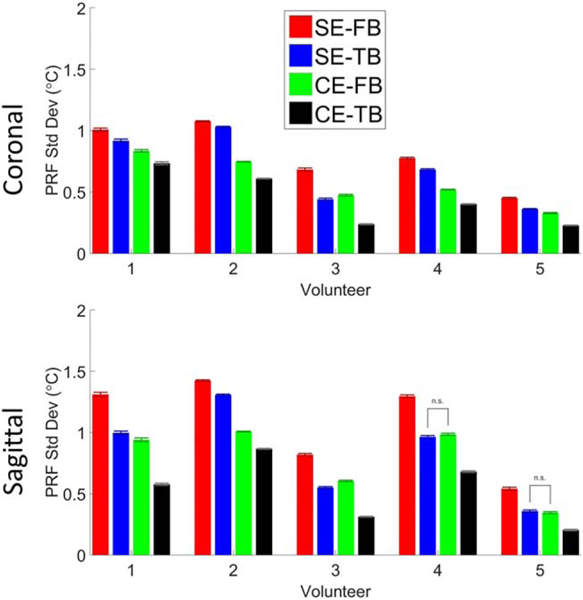
Spatially averaged PRF standard deviation values from image set 1 for the last TE in aqueous tissue in the breast for each volunteer in the coronal and sagittal orientations for each of the four calculation methods. Errors bars are the standard error of the spatial values. PRF temperature calculated using the SE-FB (red), SE-TB (blue), CE-FB (green), and CE-TB (black) methods. Bars between methods indicate no statistically significant difference between the methods. Data for image sets 2 and 3 are included in Supporting Figure S5.
Examples of the exponential decay fit are shown in Figure 8. Figure 8b shows an example of measurements whether or not the offset C is accounted for, and Figure 8c gives an example of the offset C within the breast. Figure 9a shows the percent change from baseline of M(0) and using only the in phase echoes for volunteer 2. In all cases the precision of the M(0) and estimates were better when only including the in-phase echoes instead of all echoes and an example is shown in Figure 9b. Time averaged values for M(0), and offset C from the KWIC reconstructed images were nearly identical (within ~5%) to those obtained from fully sampled (without KWIC) images (not shown).
FIG. 9.
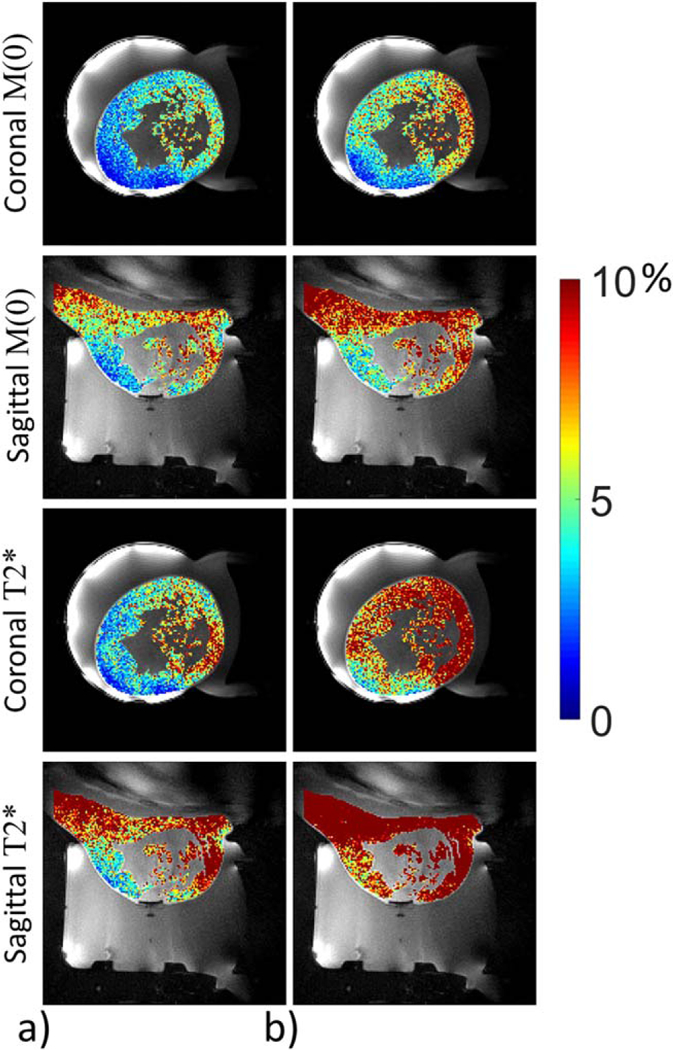
Standard deviation through time maps for volunteer 2 of M(0) and as a percent difference from the baseline value determined using the trajectory matched baseline library using only the in phase echoes (a) and using all echoes in the fit (b). Standard deviation through time maps for all volunteers are included in Supporting Figure S6.
The FUS heating in pork results are shown in Figure 10. When heating within aqueous tissue, the CE-TB PRF measurements from the KWIC SOS sequence were comparable with those obtained from the seg-EPI sequence (Fig. 10a). Time lapse videos of the PRF temperature change using the SOS and seg-EPI sequences are provided in Supporting Video S2. Both and M(0) showed temperature dependence in pork adipose tissue when heating with FUS (Fig. 10b).
FIG. 10.
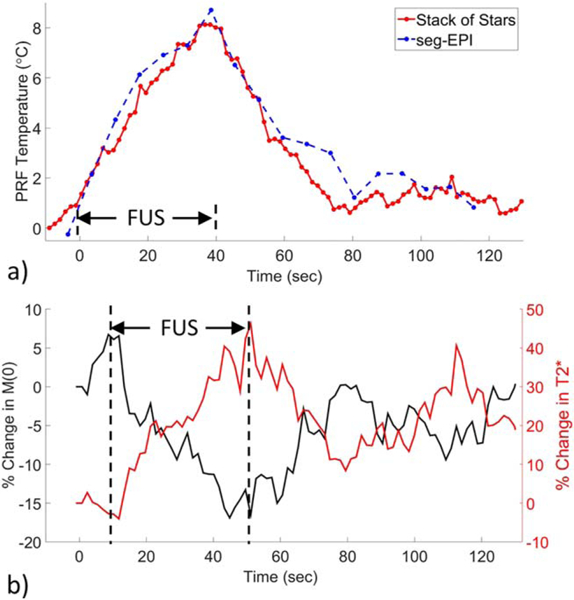
Phantom FUS heating. a: PRF temperature change during FUS heating in aqueous tissue within a pork phantom. Solid red line, CE-TB SOS sequence. Dashed blue line, seg-EPI sequence. b: Percent change in M(0) (black line) and percent change in (red line) during FUS heating in adipose tissue within a pork phantom. Vertical bars indicate the duration of the FUS. Time lapse PRF temperature video is included in Supporting Video S2. PRF temperature vs time plots using all four methods as well as different KWIC window sizes are included in Supporting Figure S7
DISCUSSION
The multi-echo SOS acquisition and reconstruction method described in this study provides simultaneous measurements of PRF temperature change, M(0), and water/fat separation with a large FOV (208 × 208 × 20.8 mm) with high spatial (1.3 mm isotropic) and temporal (1.43 s) resolution. The PRF precision (temperature standard deviation) ranged between ~0.3°C and 1.0°C between the volunteers and the coronal and sagittal orientations, and the measured PRF temperature change during MRgFUS was comparable to a 3D seg-EPI sequence.
The multiple echo acquisition provided several advantages. Self-navigated respiration correction allowed for free breathing and improved PRF precision, as seen in Figure 6, and did not affect temperature measurement accuracy in a nonbreathing phantom as shown in Supporting Figure S7c. There was no need for fat saturation because the high readout bandwidth and radial acquisition minimized the chemical shift artifact. The phase information from each echo was combined to significantly improve the PRF temperature measurement precision as quantified in Figure 7. For voxels with significant mixing of water and fat, phase combination would likely produce errors due to the frequency difference between water and fat. Combining the phases of only the in-phase echoes would reduce the error due to the fat mixture, but would use fewer echoes in the combination. The magnitude information from the in-phase echoes was combined to calculate M(0) and , which could potentially be used as a measure of temperature change in adipose tissue as seen in Figure 10b. The SOS sequence provided comparable heating profiles to a 3D seg-EPI sequence as shown in Figure 10a. Another advantage of the SOS sequence is that it does not have the same image distortion that is present in a seg-EPI sequence as seen in Supporting Video S2.
The KWIC window improves the temporal resolution while maintaining the high spatial resolution. It also causes the undersampling artifacts to vary between reconstructed time points due to the k-space distribution rotation between reconstructed time points and was the primary source of error in the SE-FB and CE-FB PRF measurements. Using the PGA increment causes the undersampling artifacts to repeat and allows for the use of a trajectory-matched baseline library, which gave significant improvement when using the SE-TB and CE-TB measurements. The PRF temperature measurements calculated from the combined echo phase and using the baseline library had statistically significant improvement in precision compared with those calculated from a single echo phase with a single baseline. Each k-space disk enclosed by a KWIC ring represents objects or object details within a specific size range. The KWIC algorithm updates central k-space (the central disk), which represents larger object detail, with a higher temporal resolution. Fine object details are updated at the same rate with the sliding window, but will have a lower temporal resolution as this information is enclosed by the outer rings of the KWIC window.
The temporal resolution of the focus will depend on the KWIC window attributes (number of inner/outer lines, update rate) and the size of the focus. The total number of lines included in the KWIC window can also be adjusted. The KWIC window used in this work had a temporal window covering 75 s for image set 1 and 41 s for image set 2. The full effect of different KWIC window parameters and focus sizes remains to be investigated, and the authors have plans to investigate with simulation and experimental studies. Lowering the total number of lines will improve the temporal resolution of each ring while sacrificing SNR to increased undersampling artifacts, Figure 1c. These artifacts could possibly be reduced through a compressed sensing or regularized reconstruction (50). While all the images in this study were updated at a constant rate of 13 projections, the PGA allows for arbitrary temporal position of the reconstruction. The trajectory-matched baseline library can still be used with an arbitrary temporal position by an appropriate shift of the KWIC window to select a baseline image reconstructed with the same k-space distribution rotation.
The precision of the PRF, M(0), and measurements depended on several factors, which include location within the breast (distance from chest wall and from imaging coils), the number of lines included in the KWIC window, and the image orientation. Voxels closer to the chest wall experienced greater respiration artifact. The respiration correction assumes a spatially uniform off resonance, which is a more accurate assumption in the coronal orientation, although tissue sufficiently far away from the chest in the sagittal images had comparable PRF precision to the coronal images, as seen in Figure 4. The self-navigated respiration measurement is affected by any gradient timing errors, which become more problematic as readout bandwidth increases. The timing errors were measured (29) for the SOS sequence on the Siemens Prisma scanner and were found to be negligible.
Changes in M(0) and with temperature need calibration and verification before reliable temperature measurements can be made through either parameter. The accuracy of measurements made with this sequence and reconstruction method remains to be assessed. The precisions of M(0) and were higher in adipose tissue compared with aqueous, likely due to the higher signal intensity from the shorter T1 of adipose tissue. It has been shown that T2 in adipose tissue will increase with temperature (40,41). is also affected by any intravoxel dephasing. A large temperature gradient across a voxel will decrease , creating an opposite dependence with temperature. Decreasing the voxel size will attenuate this problem but will also lower SNR. The only effect that the KWIC window had on M(0) and measurements, when compared with values from images reconstructed without a KWIC window, was to decrease SNR due to the retrospective undersampling.
The effective noise variance C was spatially variant, as shown in Figure 8c, which indicates that the noise is not Gaussian distributed white noise after regridding the SOS sequence (51), although the true source of the spatial variation remains to be determined. Removing the signal offset from the exponential decay has been done in previous studies, with varying explanations for the cause (52–54). measurements were more uniform within the breast when taking into account C as shown in Figure 8b. The standard deviation through time of was also improved when accounting for C (not shown). The offset value C used when fitting the exponential decay is only an approximation of the true effects of noise in non-Cartesian magnitude MR images. A more accurate model of the noise may improve the M(0) and precision further.
CONCLUSIONS
This work provides promising results for implementing a 3D method of monitoring thermal therapies using a multi-echo PGA SOS sequence. This novel sequence provides PRF temperature, M(0), and (which may become useful indicators of temperature change), water/fat separation, allows for free breathing and has high spatial and temporal resolution. The sliding KWIC window with PGA acquisition increases its versatility by allowing reconstruction of images at arbitrary time points. PRF temperature precision was significantly improved by combining phases from multiple echoes and by using a trajectory-matched baseline library. The temperature measurement accuracy during FUS heating was comparable to a 3D seg-EPI sequence.
Supplementary Material
Fig. S1. Example of the amount of aliasing artifact in the magnitude and phase images as a function of total projections included in the KWIC window. Fewer lines have more aliasing as well as lower spatial resolution due to insufficient coverage of the outer regions of k-space.
Fig. S2. Separated water (left) and fat (right) images for in vivo breast coronal (left column) and sagittal (right column) for five volunteers and pork phantom (bottom left). Yellow line in fat images display the location of the center slice in the other orientation.
Fig. S3. Average PRF precision improvement comparing without and with respiration correction in aqueous tissue using the CE-TB method for coronal (a) and sagittal (b) image orientations.
Fig. S4. Spatially averaged PRF standard deviation as a function of TE in aqueous tissue in the breast for volunteer 3. Error bars are the standard error of the spatial values. PRF temperature calculated using: Red, SE-FB method; Blue, SE-TB method; Green, CE-FB method; Black, CE-TB method. The combined phases (CE methods) only used the echoes up to and included the displayed TE.
Fig. S5. a: Spatially averaged PRF temporal standard deviation values for the last TE in aqueous tissue in the breast for each volunteer in the coronal and sagittal orientations for each of the four calculation methods. Error bars are the standard error of the spatial values. PRF temperature calculated using: Red, SE-FB method; Blue, SE-TB method; Green, CE-FB method; Black, CE-TB method. Bars between methods indicate no statistically significant difference between the methods. b: Average improvement compared with the SE-FB method as a percent difference in a voxel by voxel difference. Bars between improvement values indicate no statistically significant difference between the methods.
Fig. S6. Standard deviation through time maps for all volunteers of M(0) and as a percent difference from the baseline value determined using the trajectory matched baseline library.
Fig. S7. Phantom FUS heating. a: PRF temperature change during FUS heating in aqueous tissue within a pork phantom comparing the four SOS PRF methods and a seg-EPI sequence. b: PRF temperature change from SOS images reconstructed with different total number of lines included in the KWIC window. Each KWIC window had 13 lines in the center ring and advanced 13 lines between reconstructed time points. c: Comparison of temperature change reconstructed with and without respiration correction.
Video S1. Reconstructed time images with varying KWIC window sizes.
Video S1. Reconstructed time images with varying KWIC window sizes.
Acknowledgments
Grant sponsor: NIH; Grant numbers: R01 CA172787, R01 EB013433; Grant sponsor: Siemens Medical Solutions.
APPENDIX A
To simplify the readability of the solution, we will express the magnitude of a single pixel x at the jth echo as yj and the phase of pixel x at the jth echo as The weighted linear least squares function in Equation [6] is minimized by taking the derivate of with respect to a and b and setting both equations equal to zero.
| [A1] |
When put into matrix form, this becomes
| [A2] |
To slightly simplify these equations, we can define the following variables
| [A3] |
The first matrix is inverted and multiplied to both sides to obtain the following solutions to a and b
| [A4] |
The combined phase at any TE is then simply given by
| [A5] |
APPENDIX B
The magnitude of the measured MRI signal in the presence of noise has the form:
| [B1] |
where C represents the effective noise variance, which may be spatially variant in radial sequences, A = M(0)2 and This can be expressed with the following form:
| [B2] |
The offset C can be estimated without using an iterative process (55). Start by subtracting C from both sides and taking the derivative with respect to t.
| [B3] |
| [B4] |
| [B5] |
Defining the error function to be
| [B6] |
The total squared error to minimize is
| [B7] |
This error function is optimized further by weighting the squared error by the inverse of y to give more weight to samples closer to the offset C.
| [B8] |
The total error function in Equation [B8] is minimized to estimate the value of the constant C by taking the derivate of X2 with respect to B and C, setting both equations equal to zero and solving for C, which has the following solution.
| [B9] |
In discreet form with uniform spacing between samples, the solution for C has the following form
| [B10] |
where n is the total number of samples.
REFERENCES
- 1.Stafford RJ, Hazle JD. Magnetic resonance temperature imaging for focused ultrasound surgery: a review. Top Magn Reson Imaging 2006; 17:153–163. [DOI] [PubMed] [Google Scholar]
- 2.Jolesz FA. MRI-guided focused ultrasound surgery. Annu Rev Med 2009;60:417–430. [DOI] [PMC free article] [PubMed] [Google Scholar]
- 3.Medel R, Monteith SJ, Elias WJ, Eames M, Snell J, Sheehan JP, Wintermark M, Jolesz FA, Kassell NF. Magnetic resonance-guided focused ultrasound surgery. Part 2: a review of current and future applications. Neurosurgery 2012;71:755–763. [DOI] [PMC free article] [PubMed] [Google Scholar]
- 4.Kennedy JE, Ter Haar GR, Cranston D. High intensity focused ultrasound: surgery of the future? Br J Radiol 2003;76:590–599. [DOI] [PubMed] [Google Scholar]
- 5.Tempany CM, McDannold NJ, Hynynen K, Jolesz FA. Focused ultrasound surgery in oncology: overview and principles. Radiology 2011; 259:39–56. [DOI] [PMC free article] [PubMed] [Google Scholar]
- 6.Rieke V, Butts Pauly K. MR thermometry. J Magn Reson Imaging 2008;27:376–390. [DOI] [PMC free article] [PubMed] [Google Scholar]
- 7.Salomir R, Delemazure AS, Palussiere J, Rouviere O, Cotton F, Chapelon JY. Image-based control of the magnetic resonance imaging-guided focused ultrasound thermotherapy. Top Magn Reson Imaging 2006;17:139–151. [DOI] [PubMed] [Google Scholar]
- 8.Pinton G, Aubry JF, Bossy E, Muller M, Pernot M, Tanter M. Attenuation, scattering, and absorption of ultrasound in the skull bone. Med Phys 2012;39:299–307. [DOI] [PubMed] [Google Scholar]
- 9.Gallay MN, Moser D, Rossi F, Pourtehrani P, Magara AE, Kowalski M, Arnold A, Jeanmonod D. Incisionless transcranial MR-guided focused ultrasound in essential tremor: cerebellothalamic tractotomy. J Ther Ultrasound 2016;4:5. [DOI] [PMC free article] [PubMed] [Google Scholar]
- 10.Magara A, Buhler R, Moser D, Kowalski M, Pourtehrani P, Jeanmonod D. First experience with MR-guided focused ultrasound in the treatment of Parkinson’s disease. J Ther Ultrasound 2014;2:11. [DOI] [PMC free article] [PubMed] [Google Scholar]
- 11.McDannold N, Clement GT, Black P, Jolesz F, Hynynen K. Transcranial magnetic resonance imaging-guided focused ultrasound surgery of brain tumors: initial findings in 3 patients. Neurosurgery 2010;66: 323–332; discussion 332. [DOI] [PMC free article] [PubMed] [Google Scholar]
- 12.Schlesinger D, Benedict S, Diederich C, Gedroyc W, Klibanov A, Larner J. MR-guided focused ultrasound surgery, present and future. Med Phys 2013;40:080901. [DOI] [PMC free article] [PubMed] [Google Scholar]
- 13.Weintraub D, Elias WJ. The emerging role of transcranial magnetic resonance imaging-guided focused ultrasound in functional neurosurgery. Mov Disord 2017;32:20–27. [DOI] [PubMed] [Google Scholar]
- 14.Hinkelman LM, Liu DL, Waag RC, Zhu Q, Steinberg BD. Measurement and correction of ultrasonic pulse distortion produced by the human breast. J Acoust Soc Am 1995;97:1958–1969. [DOI] [PubMed] [Google Scholar]
- 15.Todd N, Vyas U, de Bever J, Payne A, Parker DL. The effects of spatial sampling choices on MR temperature measurements. Magn Reson Med 2011;65:515–521. [DOI] [PMC free article] [PubMed] [Google Scholar]
- 16.Todd N, Adluru G, Payne A, DiBella EV, Parker D. Temporally constrained reconstruction applied to MRI temperature data. Magn Reson Med 2009;62:406–419. [DOI] [PMC free article] [PubMed] [Google Scholar]
- 17.Todd N, Payne A, Parker DL. Model predictive filtering for improved temporal resolution in MRI temperature imaging. Magn Reson Med 2010;63:1269–1279. [DOI] [PMC free article] [PubMed] [Google Scholar]
- 18.Roujol S, de Senneville BD, Hey S, Moonen C, Ries M. Robust adaptive extended Kalman filtering for real time MR-thermometry guided HIFU interventions. IEEE Trans Med Imaging 2012;31:533–542. [DOI] [PubMed] [Google Scholar]
- 19.Griswold MA, Jakob PM, Heidemann RM, Nittka M, Jellus V, Wang J, Kiefer B, Haase A. Generalized autocalibrating partially parallel acquisitions (GRAPPA). Magn Reson Med 2002;47:1202–1210. [DOI] [PubMed] [Google Scholar]
- 20.Diakite M, Odeen H, Todd N, Payne A, Parker DL. Toward real-time temperature monitoring in fat and aqueous tissue during magnetic resonance-guided high-intensity focused ultrasound using a three-dimensional proton resonance frequency T1 method. Magn Reson Med 2014;72:178–187. [DOI] [PMC free article] [PubMed] [Google Scholar]
- 21.Odeen H, Todd N, Diakite M, Minalga E, Payne A, Parker DL. Sampling strategies for subsampled segmented EPI PRF thermometry in MR guided high intensity focused ultrasound. Med Phys 2014;41:092301. [DOI] [PMC free article] [PubMed] [Google Scholar]
- 22.Svedin BT, Payne A, Parker DL. Respiration artifact correction in three-dimensional proton resonance frequency MR thermometry using phase navigators. Magn Reson Med 2016;76:206–213. [DOI] [PMC free article] [PubMed] [Google Scholar]
- 23.Fielden S, Zhao L, Miller W, Feng X, Wintermark M, Pauly KB, Meyer C. Spiral-based 3D MR thermometry. J Ther Ultrasound 2015; 3:P18. [Google Scholar]
- 24.Durand E, van de Moortele PF, Pachot-Clouard M, Le Bihan D. Artifact due to B(0) fluctuations in fMRI: correction using the k-space central line. Magn Reson Med 2001;46:198–201. [DOI] [PubMed] [Google Scholar]
- 25.Song HK, Dougherty L. k-space weighted image contrast (KWIC) for contrast manipulation in projection reconstruction MRI. Magn Reson Med 2000;44:825–832. [DOI] [PubMed] [Google Scholar]
- 26.Song HK, Dougherty L. Dynamic MRI with projection reconstruction and KWIC processing for simultaneous high spatial and temporal resolution. Magn Reson Med 2004;52:815–824. [DOI] [PubMed] [Google Scholar]
- 27.Uecker M, Lai P, Murphy MJ, Virtue P, Elad M, Pauly JM, Vasanawala SS, Lustig M. ESPIRiT--an eigenvalue approach to auto-calibrating parallel MRI: where SENSE meets GRAPPA. Magn Reson Med 2014;71:990–1001. [DOI] [PMC free article] [PubMed] [Google Scholar]
- 28.Winkelmann S, Schaeffter T, Koehler T, Eggers H, Doessel O. An optimal radial profile order based on the Golden Ratio for time-resolved MRI. IEEE Trans Med Imaging 2007;26:68–76. [DOI] [PubMed] [Google Scholar]
- 29.Block KT, Chandarana H, Milla S, et al. Towards routine clinical use of radial stack-of-stars 3D gradient-echo sequences for reducing motion sensitivity. J Korean Soc Magn Reson Med 2014;18:87–106. [Google Scholar]
- 30.McGibney G, Smith MR, Nichols ST, Crawley A. Quantitative evaluation of several partial fourier reconstruction algorithms used in mri. Magn Reson Med 1993;30:51–59. [DOI] [PubMed] [Google Scholar]
- 31.Peters DC, Derbyshire JA, McVeigh ER. Centering the projection reconstruction trajectory: reducing gradient delay errors. Magn Reson Med 2003;50:1–6. [DOI] [PMC free article] [PubMed] [Google Scholar]
- 32.Brodsky EK, Samsonov AA, Block WF. Characterizing and correcting gradient errors in non-cartesian imaging: are gradient errors linear time-invariant (LTI)? Magn Reson Med 2009;62:1466–1476. [DOI] [PMC free article] [PubMed] [Google Scholar]
- 33.Lee KJ, Paley MN, Griffiths PD, Wild JM. Method of generalized projections algorithm for image-based reduction of artifacts in radial imaging. Magn Reson Med 2005;54:246–250. [DOI] [PubMed] [Google Scholar]
- 34.Fessler JA, Sutton BP. Nonuniform fast Fourier transforms using min-max interpolation. IEEE Trans Signal Process 2003;51:560–574. [Google Scholar]
- 35.Knoll F, Scharzl A, Diwoky C, Sodickson D. gpuNUFFT - An open-source GPU library for 3D gridding with direct matlab interface. In Proceedings of the 22nd Annual Meeting of ISMRM, Milan, Italy, 2014. Abstract 4297. [Google Scholar]
- 36.Benkert T, Feng L, Sodickson DK, Chandarana H, Block KT. Free-breathing volumetric fat/water separation by combining radial sampling, compressed sensing, and parallel imaging. Magn Reson Med 2017;78:565–576. [DOI] [PMC free article] [PubMed] [Google Scholar]
- 37.Jeong HJ, Eddleman CS, Shah S, Seiberlich N, Griswold MA, Batjer HH, Carr JC, Carroll TJ. Accelerating time-resolved MRA with multie-cho acquisition. Magn Reson Med 2010;63:1520–1528. [DOI] [PMC free article] [PubMed] [Google Scholar]
- 38.Marx M, Butts Pauly K. Improved MRI thermometry with multiple-echo spirals. Magn Reson Med 2016;76:747–756. [DOI] [PMC free article] [PubMed] [Google Scholar]
- 39.Rieke V, Pauly KB. Echo combination to reduce PRF thermometry errors from fat. J Magn Reson Imaging 2008;27:673–677. [DOI] [PMC free article] [PubMed] [Google Scholar]
- 40.Ozhinsky E, Kohi MP, Ghanouni P, Rieke V. T2-based temperature monitoring in abdominal fat during MR-guided focused ultrasound treatment of patients with uterine fibroids. J Ther Ultrasound 2015;3:15. [DOI] [PMC free article] [PubMed] [Google Scholar]
- 41.Baron P, Ries M, Deckers R, de Greef M, Tanttu J, Kohler M, Viergever MA, Moonen CT, Bartels LW. In vivo T2 -based MR thermometry in adipose tissue layers for high-intensity focused ultrasound near-field monitoring. Magn Reson Med 2014;72:1057–1064. [DOI] [PubMed] [Google Scholar]
- 42.Parker DL. Applications of NMR imaging in hyperthermia: an evaluation of the potential for localized tissue heating and noninvasive temperature monitoring. IEEE Trans Biomed Eng 1984;BME-31:161–167. [DOI] [PubMed] [Google Scholar]
- 43.Peters NH, Bartels LW, Sprinkhuizen SM, Vincken KL, Bakker CJ. Do respiration and cardiac motion induce magnetic field fluctuations in the breast and are there implications for MR thermometry? J Magn Reson Imaging 2009;29:731–735. [DOI] [PubMed] [Google Scholar]
- 44.Dadakova T, Krafft AJ, Korvink JG, Meckel S, Bock M. PRF Thermometry for monitoring small temperature changes during very long thermal therapies: field drift compensation using FID navigators. In Proceedings of the 24th Annual Meeting of ISMRM, Singapore, 2016. Abstract 3600. [Google Scholar]
- 45.Roemer PB, Edelstein WA, Hayes CE, Souza SP, Mueller OM. The NMR phased array. Magn Reson Med 1990;16:192–225. [DOI] [PubMed] [Google Scholar]
- 46.Payne A, Merrill R, Minalga E, et al. Design and characterization of a laterally mounted phased-array transducer breast-specific MRgHIFU device with integrated 11-channel receiver array. Med Phys 2012;39: 1552–1560. [DOI] [PMC free article] [PubMed] [Google Scholar]
- 47.Payne A, Todd N, Minalga E, Wang Y, Diakite M, Hadley R, Merrill R, Factor R, Neumayer L, Parker DL. In vivo evaluation of a breast-specific magnetic resonance guided focused ultrasound system in a goat udder model. Med Phys 2013;40:073302. [DOI] [PMC free article] [PubMed] [Google Scholar]
- 48.Minalga E, Payne A, Merrill R, Todd N, Vijayakumar S, Kholmovski E, Parker DL, Hadley JR. An 11-channel radio frequency phased array coil for magnetic resonance guided high-intensity focused ultrasound of the breast. Magn Reson Med 2013;69:295–302. [DOI] [PMC free article] [PubMed] [Google Scholar]
- 49.Glover GH, Schneider E. Three-point Dixon technique for true water/fat decomposition with B0 inhomogeneity correction. Magn Reson Med 1991;18:371–383. [DOI] [PubMed] [Google Scholar]
- 50.Feng L, Axel L, Chandarana H, Block KT, Sodickson DK, Otazo R. XD-GRASP: golden-angle radial MRI with reconstruction of extra motion-state dimensions using compressed sensing. Magn Reson Med 2016;75:775–788. [DOI] [PMC free article] [PubMed] [Google Scholar]
- 51.Mosquera C, Irarrazabal P, Nishimura DG. Noise behavior in gridding reconstruction. In 1995 International Conference on Acoustics, Speech, and Signal Processing, Detroit, Michigan, USA, 1995. Abstract 2284. [Google Scholar]
- 52.Carneiro AAO, Vilela GR, de Araujo DB, Baffa O. MRI relaxometry: methods and applications. Braz J Phys 2006;36:9–15. [Google Scholar]
- 53.He T, Gatehouse PD, Smith GC, Mohiaddin RH, Pennell DJ, Firmin DN. Myocardial T2 measurements in iron overloaded thalassemia: an in vivo study to investigate the optimal methods of quantification. Magn Reson Med 2008;60:1082–1089. [DOI] [PMC free article] [PubMed] [Google Scholar]
- 54.Milford D, Rosbach N, Bendszus M, Heiland S. Mono-exponential fitting in T2-relaxometry: relevance of offset and first echo. PLoS One 2015;10:e0145255. [DOI] [PMC free article] [PubMed] [Google Scholar]
- 55.Bristow-Johnson Robert. Non-linear curve fitting: y = Ae^(-t/tau) + C. https://www.dsprelated.com/showthread/comp.dsp/58555-1.php Published May 24, 2006 Accessed December 4, 2016.
Associated Data
This section collects any data citations, data availability statements, or supplementary materials included in this article.
Supplementary Materials
Fig. S1. Example of the amount of aliasing artifact in the magnitude and phase images as a function of total projections included in the KWIC window. Fewer lines have more aliasing as well as lower spatial resolution due to insufficient coverage of the outer regions of k-space.
Fig. S2. Separated water (left) and fat (right) images for in vivo breast coronal (left column) and sagittal (right column) for five volunteers and pork phantom (bottom left). Yellow line in fat images display the location of the center slice in the other orientation.
Fig. S3. Average PRF precision improvement comparing without and with respiration correction in aqueous tissue using the CE-TB method for coronal (a) and sagittal (b) image orientations.
Fig. S4. Spatially averaged PRF standard deviation as a function of TE in aqueous tissue in the breast for volunteer 3. Error bars are the standard error of the spatial values. PRF temperature calculated using: Red, SE-FB method; Blue, SE-TB method; Green, CE-FB method; Black, CE-TB method. The combined phases (CE methods) only used the echoes up to and included the displayed TE.
Fig. S5. a: Spatially averaged PRF temporal standard deviation values for the last TE in aqueous tissue in the breast for each volunteer in the coronal and sagittal orientations for each of the four calculation methods. Error bars are the standard error of the spatial values. PRF temperature calculated using: Red, SE-FB method; Blue, SE-TB method; Green, CE-FB method; Black, CE-TB method. Bars between methods indicate no statistically significant difference between the methods. b: Average improvement compared with the SE-FB method as a percent difference in a voxel by voxel difference. Bars between improvement values indicate no statistically significant difference between the methods.
Fig. S6. Standard deviation through time maps for all volunteers of M(0) and as a percent difference from the baseline value determined using the trajectory matched baseline library.
Fig. S7. Phantom FUS heating. a: PRF temperature change during FUS heating in aqueous tissue within a pork phantom comparing the four SOS PRF methods and a seg-EPI sequence. b: PRF temperature change from SOS images reconstructed with different total number of lines included in the KWIC window. Each KWIC window had 13 lines in the center ring and advanced 13 lines between reconstructed time points. c: Comparison of temperature change reconstructed with and without respiration correction.
Video S1. Reconstructed time images with varying KWIC window sizes.
Video S1. Reconstructed time images with varying KWIC window sizes.


