
FIG. 3.
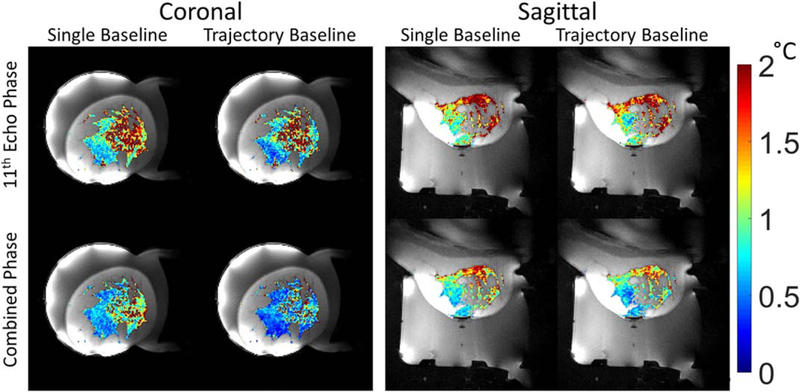
Standard deviation through time maps of PRF temperature in aqueous tissue for the four calculation methods for volunteer 2. Left column: first image used as phase reference. Right column: trajectory-matched baseline images. Top Row: PRF temperature calculated from the last echo. Bottom row: PRF temperature calculated from the combined phase.