
Fig. 3. NF-κB-mediated SASP and TNF-α secretion is required for treatment-induced NK cell activity.
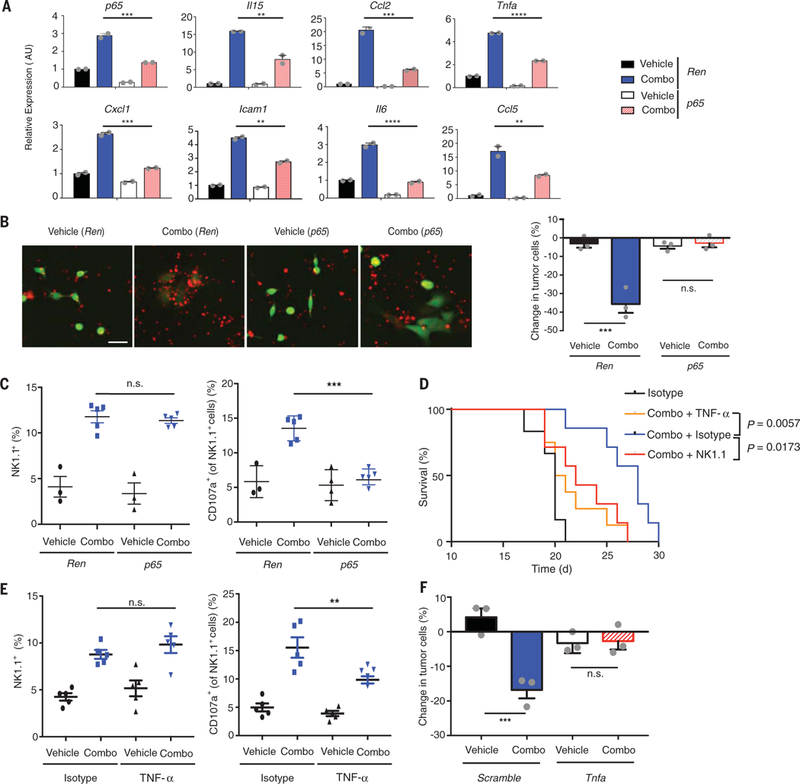
(A) Quantitative reverse transcription polymerase chain reaction analysis of SASP gene expression in KP tumor cells transduced with indicated shRNAs after treatment with vehicle or trametinib (25 nM) and palbociclib (500 nM) for 8 days. Mean of two biological replicates associated with three technical replicates is plotted. AU, arbitrary units. (B) Representative images of KP tumor cells with indicated shRNAs (green) pretreated as in (A) and cocultured with primary murine splenic NK cells (red) at a 20:1 E:T ratio for 20 hours in the presence or absence of indicated drugs (scale bar, 25 μm). Quantification of NK cell cytotoxicity (by live cell imaging) is shown on the right. Change in tumor cells is normalized to control wells lacking NK cells. Mean of three biological replicates is plotted. (C) Flow cytometry analysis of total and CD107a+ degranulating NK cells within the CD45+ population in the lungs after 1-week treatment of mice transplanted with KP tumor cells containing control Renilla (Ren) or p65 shRNAs with vehicle or combined trametinib (1 mg/kg body weight) and palbociclib (100 mg/kg body weight) (n ≥ 3 mice per group). (D) Kaplan-Meier survival curve of KP transplant mice treated with vehicle or combined trametinib (1 mg/kg body weight) and palbociclib (100 mg/kg body weight) and either an isotype control (HRPN), NK1.1 (PK136), or TNF-α (XT3.11) targeting antibody (n ≥ 6 per group) (log-rank test). (E) Flow cytometry analysis as in (C) after 1-week treatment of KP transplant mice with vehicle or combined trametinib (1 mg/kg body weight) and palbociclib (100 mg/kg body weight) and either an isotype control (HRPN) or TNF-α (XT3.11) targeting antibody (n = 5 per group). (F) Quantification of NK cell cytotoxicity (by live cell imaging) toward KP tumor cells with indicated shRNAs pretreated as in (B) and cocultured with primary murine splenic NK cells at a 20:1 E:T ratio for 20 hours in the presence or absence of indicated drugs. (A to C and E and F) One-way ANOVA. Error bars, mean ± SEM. **P < 0.01, ***P < 0.001, ****P < 0.0001.