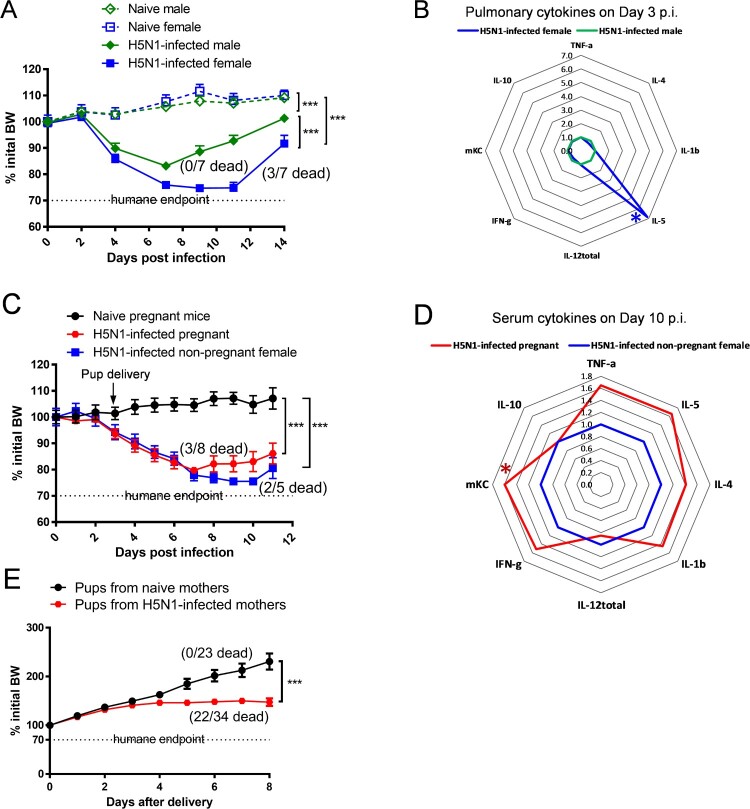
Figure 1.
. Sex-dependent differences in response to H5N1 infection. (A) Body Weight (BW) (n = 5–7 mice/group) and (B) radar chart of pulmonary cytokines on Day 3 post infection (p.i.) (n = 6 mice/cytokine/group) of age-matched male and female Balb/c mice. (C) BW (n = 5–8 mice/group) and (D) radar chart of serum cytokines on Day 10 p.i. (n = 5–8 mice/cytokine/group) of pregnant and age-matched non-pregnant female Balb/c mice. (E) BW of pups born to naïve and H5N1-infected dams (n = 23–34 pups/group). BW data are expressed as mean ± SEM. Individual cytokines are shown as fold inductions vs. male mice (B) or vs. non-pregnant female mice (D). BW, pulmonary cytokines and serum cytokines were analyzed by two-way ANOVA and unpaired Student’s t-test, respectively. *p < 0.05 and ***p < 0.001. Data are representative of 2–3 independent experiments with similar results.

