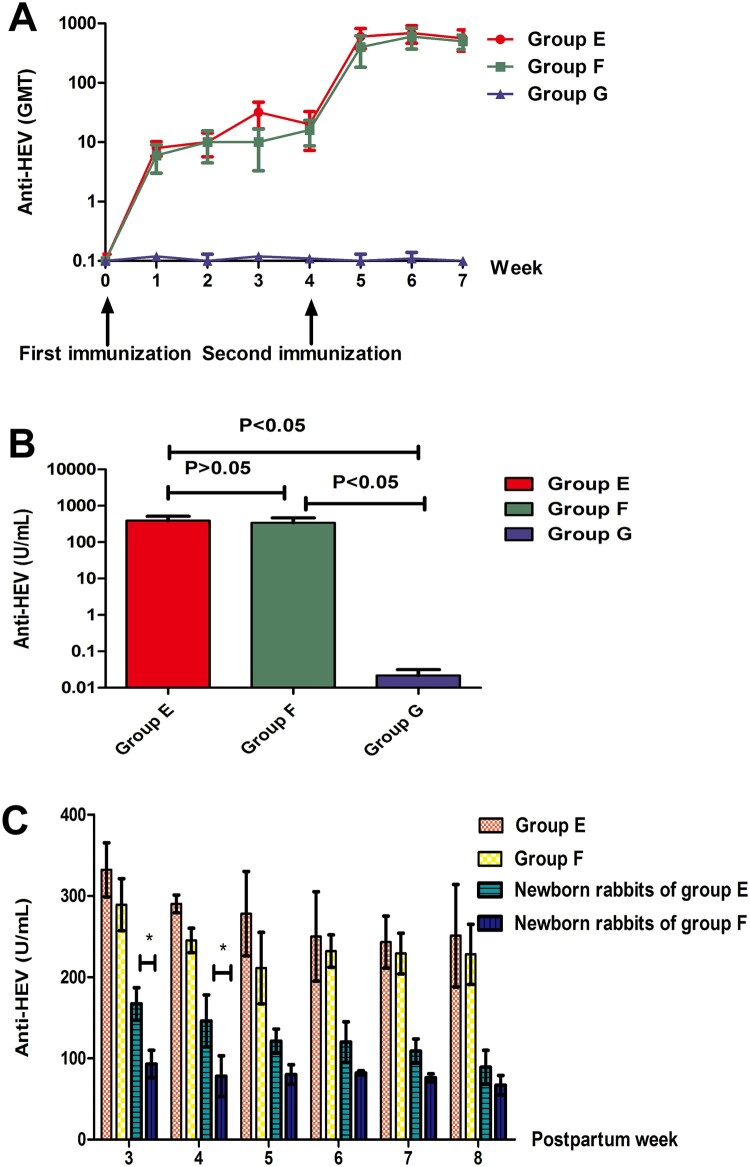
Figure 4.
Antibody responses of rabbits after vaccination. (A) Dynamics of GMT induced by various types of vaccination. (B) The comparison of anti-HEV levels in each group. Y axis represents anti-HEV levels on week 7 expressed in WHO unit/ml. (C) Postpartum protection of rabbits and newborn rabbits. Y axis represents anti-HEV levels on postpartum week 3 to week 8 expressed in WHO unit/ml (* represents P < 0.05).

