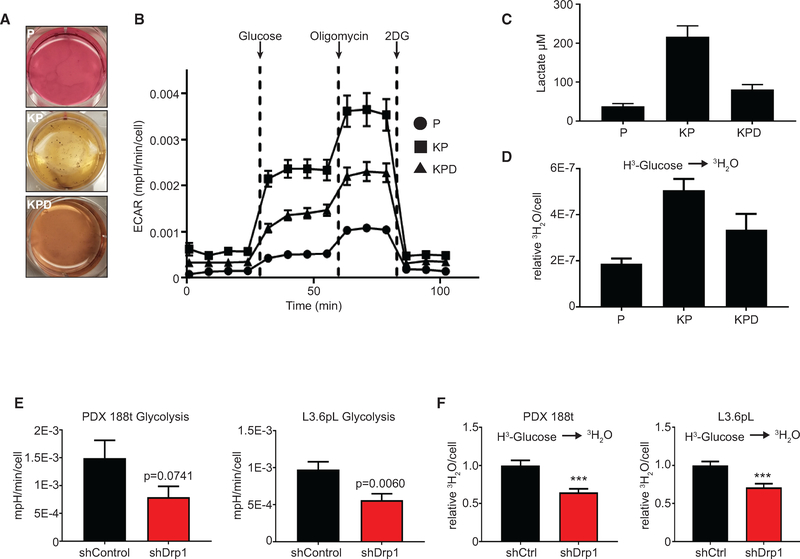
Figure 2. Loss of Drp1 Decreases KRas-Driven Glycolytic Flux.
(A) Soft agar growth from Figure 1E to analyze media color.
(B) ECAR of indicated MEFs during a glycolysis stress test (GST). Glucose, oligomycin, and 2-deoxyglucose (2-DG) were added at the indicated time points (representative result, n = 3).
(C) Extracellular lactate of indicated MEFs (n = 3).
(D) Radiotracer flux of 3H-glucose to 3H2O in indicated MEFs (n = 3).
(E) Calculated ECAR attributable to glycolysis of the indicated 14-day doxycycline-treated PDAC cell lines (n = 4).
(F) Radiotracer flux of 3H-glucose to 3H2O of the indicated 14-day doxycycline-treated PDAC cell lines (n = 3).

