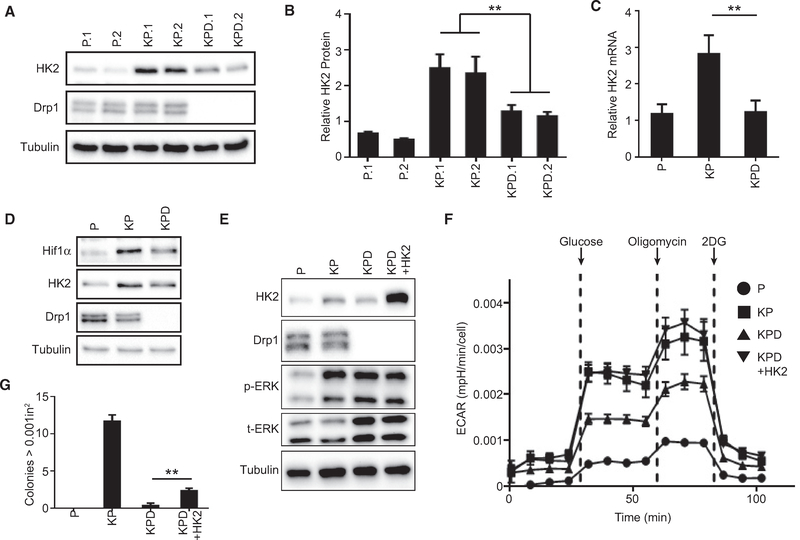
Figure 3. Drp1 Deletion Attenuates Hexokinase II Expression and Glycolytic Flux.
(A) Immunoblot analysis of HK2 and Drp1 in indicated MEFs (n = 3).
(B) Quantification of (A) (n = 3).
(C) Quantitative real-time PCR analysis of relative HK2 mRNA levels in the indicated MEFs (n = 3).
(D) Immunoblot analysis of HK2, HIF1α, and Drp1 in indicated MEFs.
(E) Immunoblot analysis of HK2, Drp1, p-ERK, and t-ERK in indicated MEFs.
(F) ECAR of the indicated MEF lines during a GST (representative result, n = 3).
(G) Soft agar growth of indicated MEFs after 3 weeks quantified for colonies >0.001 in2 (representative result, n = 3).

