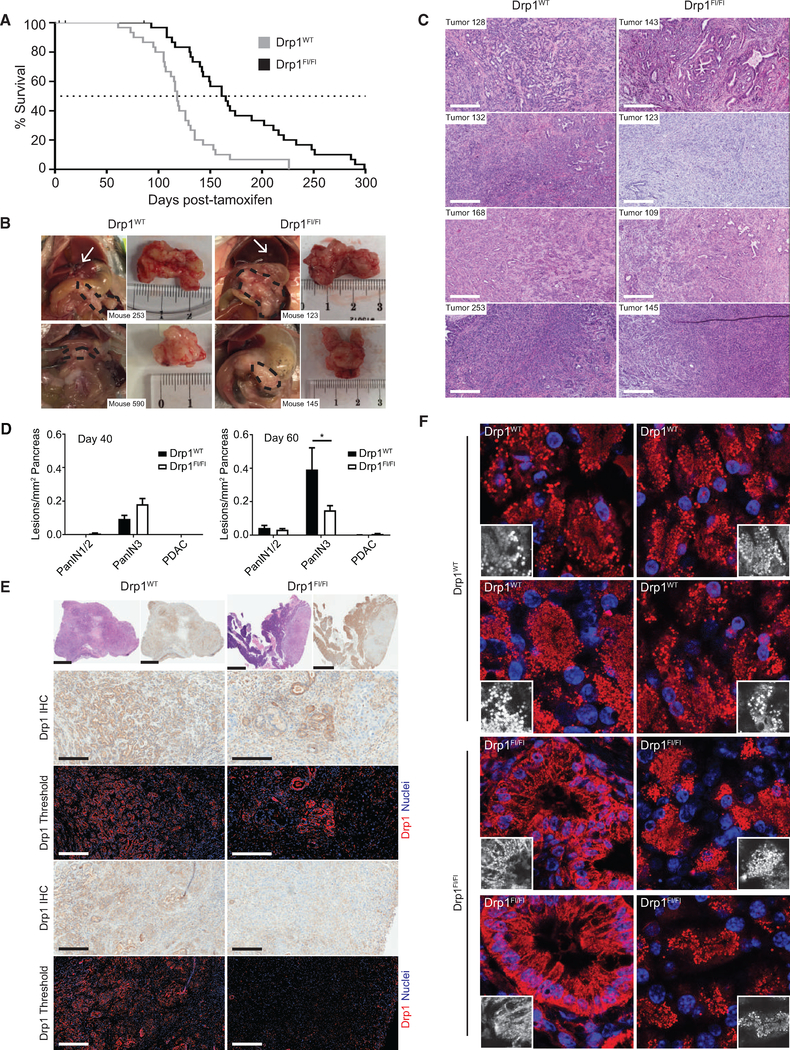
Figure 4. Loss of Drp1 Inhibits PDAC Progression.
(A) Overall survival of Drp1WT (gray line) and Drp1flox/flox (black line) KPDC mice (n = 30 mice per group).
(B) Representative gross images of PDAC (black dashed outline) and liver metastases (white arrows).
(C) Tumor sections of indicated genotypes and stained with H&E. Scale bars, 300 μm.
(D) Drp1WT and Drp1flox/flox KPDC mice 40 days (left panel; n = 4 mice per genotype) or 60 days (right panel; n = 6 mice [Drp1WT]; 8 mice [Drp1flox/flox]) after tamoxifen injection quantified for all pancreatic lesions.
(E) Drp1 IHC of tumors. Low-magnification H&E (top row, left) and corresponding IHC images of tumor (top row, right). High-magnification IHC images from regions within tumors of the top panel (rows 2 and 4). Color-deconvoluted image of high-magnification IHC image (rows 3 and 5). Scale bars, 300 μm (rows 2–5); 2 mm (top row).
(F) Representative immunofluorescence analysis of mitochondrial morphology in pancreatic tumors harvested from Drp1WT and Drp1flox/flox mice and stained with an anti-mitochondria antibody (red) and DAPI (nuclei, blue). Insets, mitochondria magnified.

