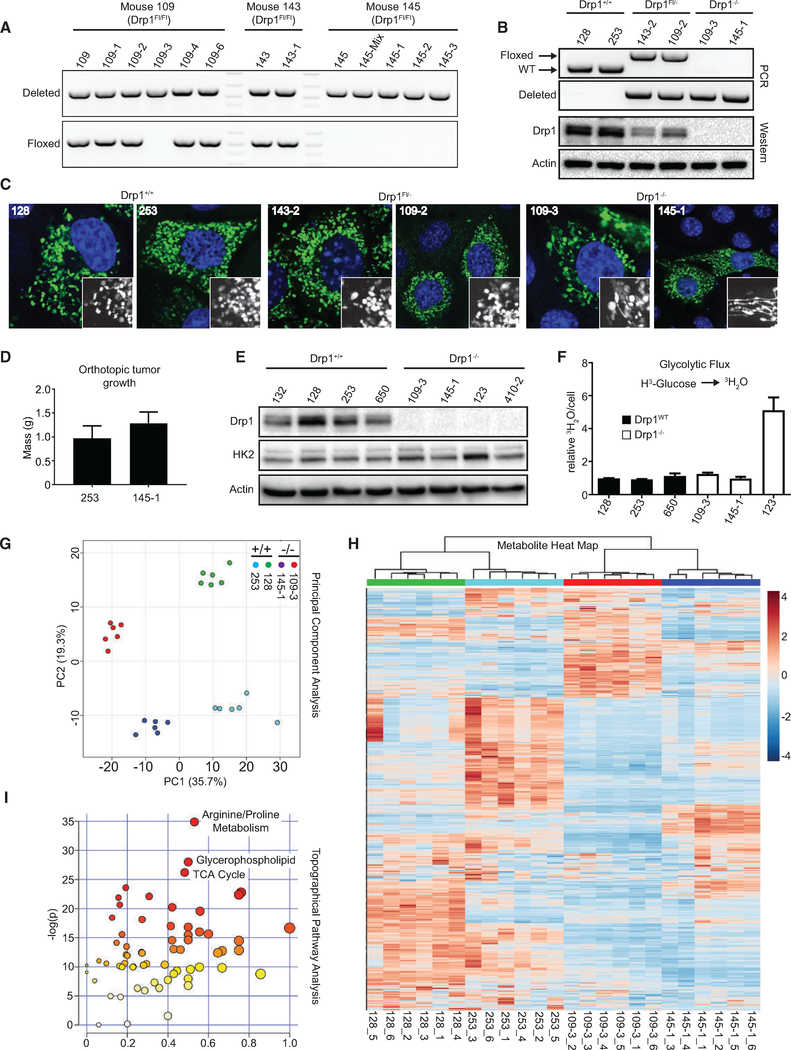
Figure 5. Drp1−/− Tumor Cell Lines Exhibit Metabolic Reprogramming.
(A) PCR on indicated cell lines; top panel detects recombination of Drp1flox allele; bottom panel detects the floxed Drp1 allele.
(B) Identical PCR reactions as in (A) and immunoblot analysis for Drp1 on indicated cell lines.
(C) Representative immunofluorescence staining of mitochondrial morphology in cells transiently transfected with mito-yellow fluorescent protein (YFP) (mitochondria, green) and stained with DAPI (nuclei, blue).
(D) Tumor mass of indicated cell lines 20 days after orthotopic injection into the pancreata of immunocompromised mice (n = 4 mice per cell line).
(E) Immunoblot analysis of HK2 and Drp1 in indicated tumor cell lines (representative result, n = 3).
(F) Radiotracer flux of 3H-glucose to 3H2O in indicated cell lines (n = 3).
(G) Principal-component analysis of metabolomics profiles for six replicates of each of the indicated cell lines.
(H) Hierarchical cluster analysis on all of the metabolites detected in (G).
(I) Topographical pathway enrichment analysis on metabolomics data from indicated cell lines.

